我有一个包含科隆所有街道的shapefile (SpatialLinesDataFrame),可以从这里下载。我将此@data与外部数据源的数据合并。如何绘制这些街道(如果可能的话使用ggmaps在谷歌地图上),以便每条街道都具有不同的颜色(或粗细),取决于其个体价值?
到目前为止,我已经完成了以下工作:
到目前为止,我已经完成了以下工作:
shapefile <- readOGR(shapfile, "Strasse", stringsAsFactors=FALSE,
encoding="latin-9")
shp <- spTransform(shapefile, CRS("+proj=longlat +datum=WGS84"))
此时,我向shp@data数据框中添加了另一列,其中包含每条街道的某个值。然后,我加强了shapefile,以便可以使用ggplot进行绘图:
shp$id <- rownames(shp@data)
shp.df <- as.data.frame(shp)
data_fort <- fortify(shp, region = "id")
data_merged <- join(data_fort, shp.df, by="id")
当我使用geom_lines时,线条不够美观且不易辨认:
ggplot(data_merged, aes(x=long, y=lat,
                      group=group,
                      colour=values)) +
 geom_line()
这里我看到可以转换shapefile以便使用geom_segment(或在这种情况下修改的函数“geom_segment2”),但会失去街道特定的值。
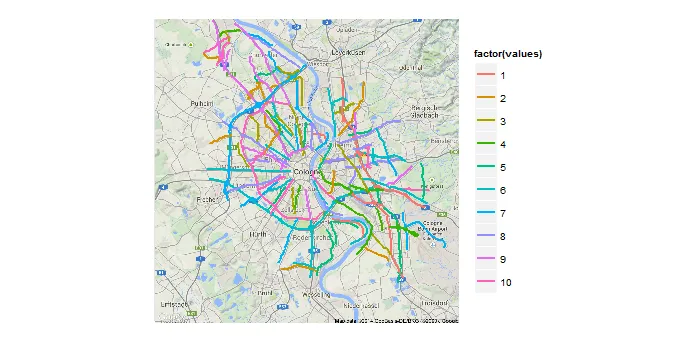
geom_path(...)而不是geom_line(...)。 - jlhoward