看起来这应该是一个重复的问题,但我在SO搜索中找不到它。我知道它已经出现在rhelp上很多次了。但是有一个命令可以解决它:
require(fortunes)
fortune("every question")
Lastly, by what we could call the 'Liaw-Baron principle', every question that can be
asked has in fact already been asked.
-- Dirk Eddelbuettel (citing Andy Liaw's and Jonathan Baron's opinion on unique
questions on R-help)
R-help (January 2006)
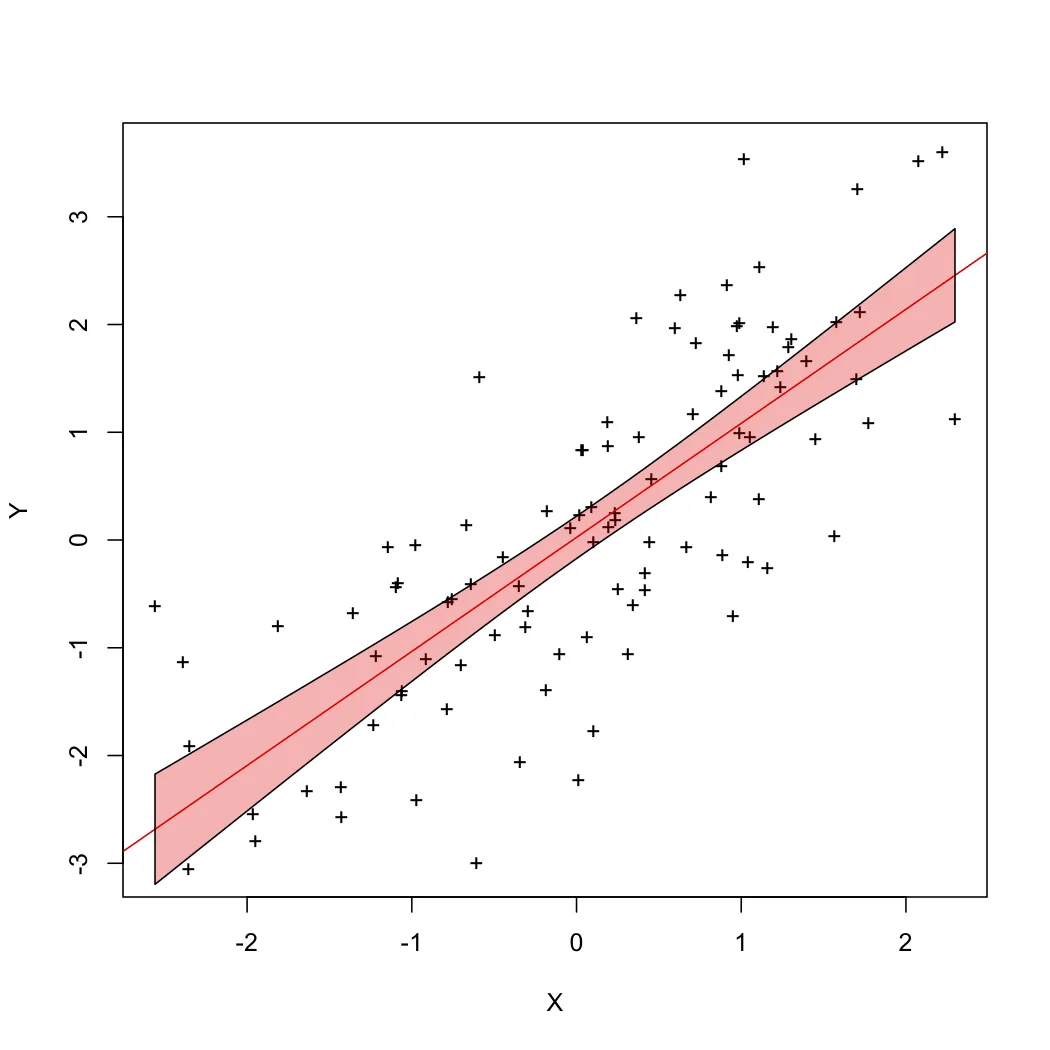
polygon(x= c(X[order(X)], rev(X[order(X)]) ), # both x and y go "out" in order;
y=c(L[order(X)], rev(U[order(X)])), # and then come "back in reverse order
col=rgb(1,0,0,0.3) ) # transparent pink.
> plot(X,Y, pch="+")
> abline(reg, col="red")
> polygon(x= c(X\[order(X)\], rev(X\[order(X)\]) ), y=c(L\[order(X)\],rev(U\[order(X)\])), col=rgb(1,0,0,0.3) )