我是gnuplot的新手,正在尝试为一个项目创建一个堆积柱状图。我遇到的问题是,我无法在x轴上放置ticlabels(即使我可以,它们也没有以整齐的方式格式化)。我的gp文件如下:
以下是我的数据文件快照:
这是图表的图片: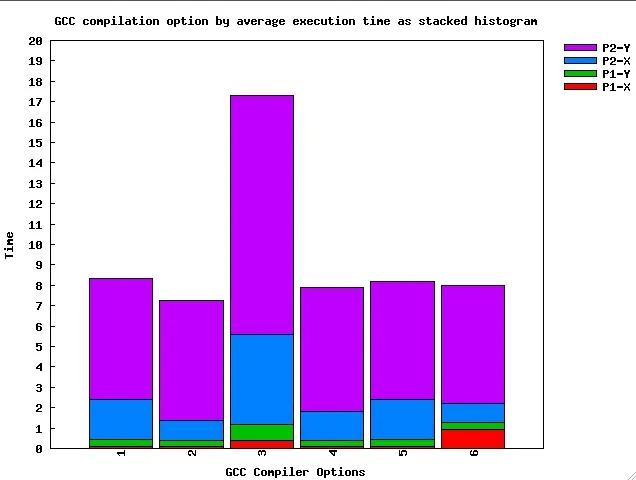 现在,在x轴上,我有1、2、3 - 6,但我不想要这些数字,相反,我希望以整洁格式显示“O2-ffast-math-finline-functions”等内容。
在查阅gnuplot页面上的一些示例后,我编写了此脚本,对某些动词没有很好的理解,因此除了解决方案之外,欢迎任何一般性的评论。
谢谢, Sayan
以下是我的数据文件快照:
CC P1-X P1-Y P2-X P2-Y
1 0.1097586  0.3262812  1.980848  5.9098402
2 0.1010986  0.2988812  0.9966702  5.8378412
3 0.4017474  0.7559452  4.41813  11.7404132
4 0.1028442  0.2974772  1.418744  6.0554552
5 0.1097316  0.3216112  1.967492  5.8007364
6 0.954794  0.3004874  0.9568386  5.778537
这是我的gp文件:
set title "GCC compilation option by average execution time as stacked histogram"
set terminal jpeg medium
set output "histosmalldata.jpeg"
set boxwidth 0.9 absolute
set style fill solid 1.00 border -1
set key autotitle columnheader
set key outside right top vertical Left reverse enhanced autotitles columnhead nobox
set key invert samplen 4 spacing 1 width 0 height 0
set style histogram rowstacked title  offset character 0, 0, 0
set style data histograms
set xtics border in scale 1,0.5 nomirror rotate by -45  offset character 0, 0, 0
set xtics norangelimit
set xtics ("O2-ffast-math-finline-functions" 1, "O2-funroll-loops-march=barcelona-ffast-math-finline-functions" 2, "GCCFLAGS_O0" 3, "O2-ftree-vectorize-funroll-loops-march=barcelona" 4, "GCCFLAGS_O2" 5, "O2-ftree-vectorize-funroll-loops-ffast-math" 6)
set xtics 1,6 nomirror
set ytics 0,100 nomirror
set ytics 1
set yrange [0:20]
set ylabel "Time"
set xlabel "GCC Compiler Options"
plot 'smalldata' using 2:xtic(1) ti col, '' using 3 ti col, '' using 4 ti col, '' using 5 ti col
这是图表的图片:
现在,在x轴上,我有1、2、3 - 6,但我不想要这些数字,相反,我希望以整洁格式显示“O2-ffast-math-finline-functions”等内容。在查阅gnuplot页面上的一些示例后,我编写了此脚本,对某些动词没有很好的理解,因此除了解决方案之外,欢迎任何一般性的评论。
谢谢, Sayan