MPAndroidChart填充颜色渐变

15

使用MPAndroidChart(或任何其他Android图表库)是否可以在绘制线下面用渐变色填充图表?类似于这样:

set1.setFillColor(getResources().getColor(R.drawable.chart_fill));

然后在 chart_fill.xml 中:

<shape xmlns:android="http://schemas.android.com/apk/res/android"
    android:shape="rectangle" >

    <gradient
        android:angle="90"
        android:endColor="#FF207a54"
        android:startColor="#FFffffff" />

</shape>
这个有任何更新吗?在MPAndroidChart的新版本中是否包含了渐变填充颜色功能? - VladimirVip
3个回答

45

您可以使用以下两种方法:

LineRadarDataSet#setDrawFilled(boolean isFilled); 
LineRadarDataSet#setFillDrawable(Drawable d);

这是一个指向该类的 javadoc 的链接。

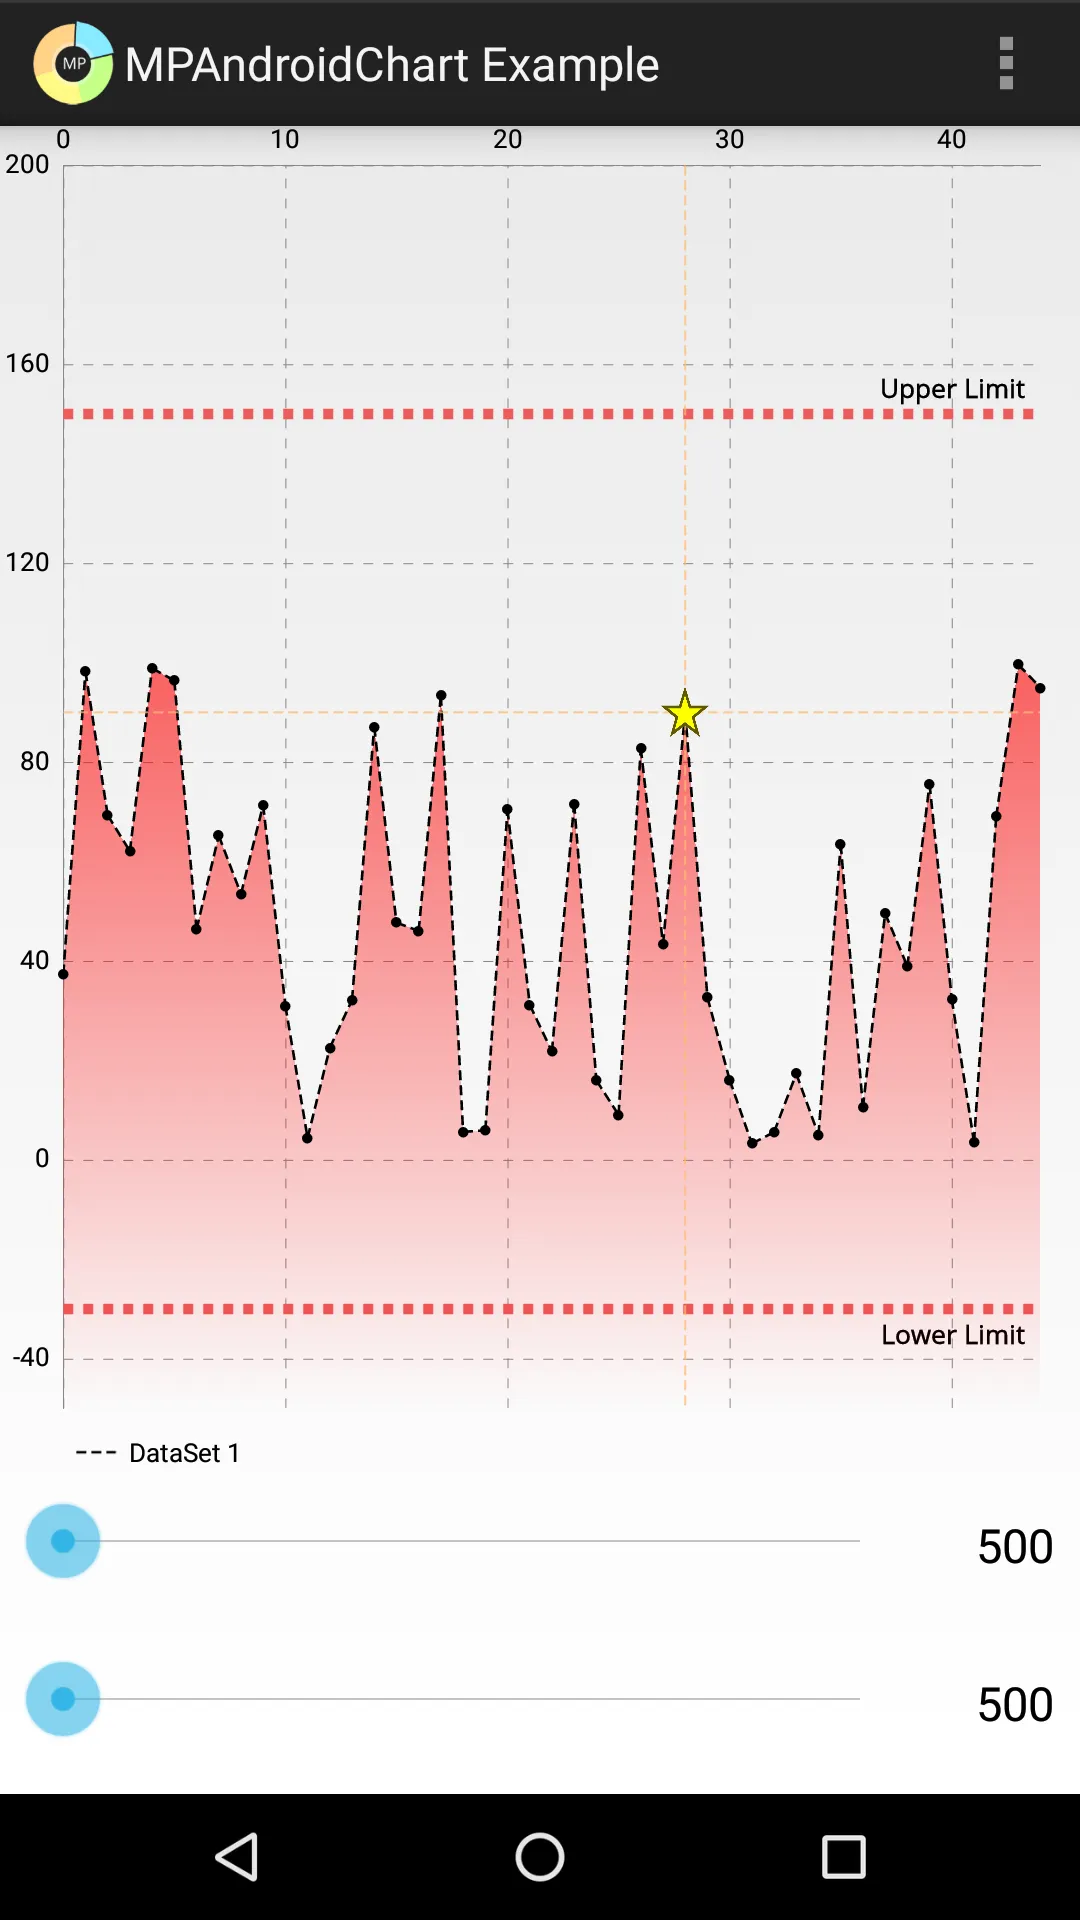
这是来自 MPAndroidChart示例项目的示例:

set1.setDrawFilled(true);
if (Utils.getSDKInt() >= 18) {
    // fill drawable only supported on api level 18 and above
    Drawable drawable = ContextCompat.getDrawable(this, R.drawable.fade_red);
    set1.setFillDrawable(drawable);
}
else {
    set1.setFillColor(Color.BLACK);
}

fade_red.xml中:

<?xml version="1.0" encoding="utf-8"?>
<shape xmlns:android="http://schemas.android.com/apk/res/android">
    <gradient
        android:angle="90"
        android:startColor="#00ff0000"
        android:endColor="#ffff0000" />
</shape>

这是 LineChart 的一个示例:

带有红色渐变填充的折线图


2
如何根据正负值使用不同的颜色进行填充? - hannes ach
2
你还应该添加 set1.setDrawFilled(true); 以显示填充。希望这能帮助到某个人。 - Neri
如何去除这条虚线? - Waqar Vicky
这应该是一个被接受的答案。 - Rabindra Khadka

10

Kotlin 解决方案:

if (Build.VERSION.SDK_INT >= Build.VERSION_CODES.JELLY_BEAN_MR2) {
    lineDataSet.setDrawFilled(true)
    val fillGradient = ContextCompat.getDrawable(requireContext(), R.drawable.red_gradient)
    lineDataSet.fillDrawable = fillGradient
}

这里是red_gradient.xml文件:

<?xml version="1.0" encoding="utf-8"?>
<shape xmlns:android="http://schemas.android.com/apk/res/android">
    <gradient
        android:angle="90"
        android:startColor="#00F81616"
        android:endColor="#ffF81616" />
</shape>

5

好的,我已经找到了一个解决方案:

William Chart,我正在使用这种方法:

int[] colors = { getResources().getColor(R.color.menu_text),
 getResources().getColor(android.R.color.white) };

float[] index = { 0, 1 };
dataset.setGradientFill(colors, index);

网页内容由stack overflow 提供, 点击上面的
可以查看英文原文,
原文链接