我是一名老牌的R用户,但是在理解ggplot2方面有些困难。在这个例子中,当我使用geom="path"选项并设置alpha时,无法得到图例。如果我将geom="point"设置为正常,它会出现。
tmp <- data.frame(cx=rnorm(21),cy=rnorm(21),labels=c(rep("a",7),rep("b",7),rep("c",7)))

p1 <- qplot(data=tmp,cx,cy,geom="point",colour = labels, size=I(5), alpha=I(0.5))
然后点的图形看起来很好,包括一个带有正确alpha设置的图例显示点。添加geom="path"。
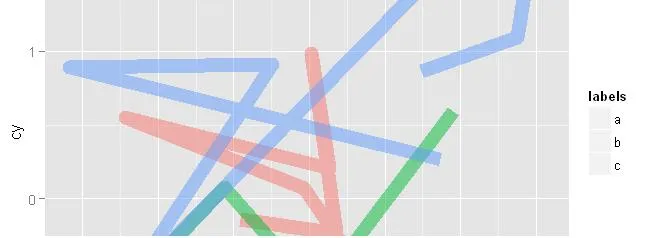
p2 <- qplot(data=tmp,cx,cy,geom="path",colour = labels, size=I(5), alpha=I(0.5))
获取一个将线条连接并正确绘制alpha设置的情节,并且图例也出现但是为空 - 例如,没有alpha颜色。这个可能做得到吗?
如果删除alpha参数,则所有内容都正常工作,我可以在情节和图例中获得实心颜色。
更新:感谢您迄今为止的评论,但我想这只是我或我的设置,因为我仍然有这个问题。在链接中我所获得的一个示例...
http://i.stack.imgur.com/LiEwD.jpg
为了完整性...
> sessionInfo()
R version 2.15.0 (2012-03-30)
Platform: i386-pc-mingw32/i386 (32-bit)
locale:
[1] LC_COLLATE=English_United Kingdom.1252  LC_CTYPE=English_United Kingdom.1252       LC_MONETARY=English_United Kingdom.1252
[4] LC_NUMERIC=C                            LC_TIME=English_United Kingdom.1252
attached base packages:
[1] grid      stats     graphics  grDevices utils     datasets  methods   base
other attached packages:
[1] scales_0.2.1  ggplot2_0.9.1
loaded via a namespace (and not attached):
[1] colorspace_1.1-1   dichromat_1.2-4    digest_0.5.2       labeling_0.1       MASS_7.3-17        memoise_0.1
[7] munsell_0.3        plyr_1.7.1         proto_0.3-9.2      RColorBrewer_1.0-5 reshape2_1.2.1     stringr_0.6
[13] tools_2.15.0