 我在Jupyter Notebook中的一行代码中使用 %matplotlib notebook。
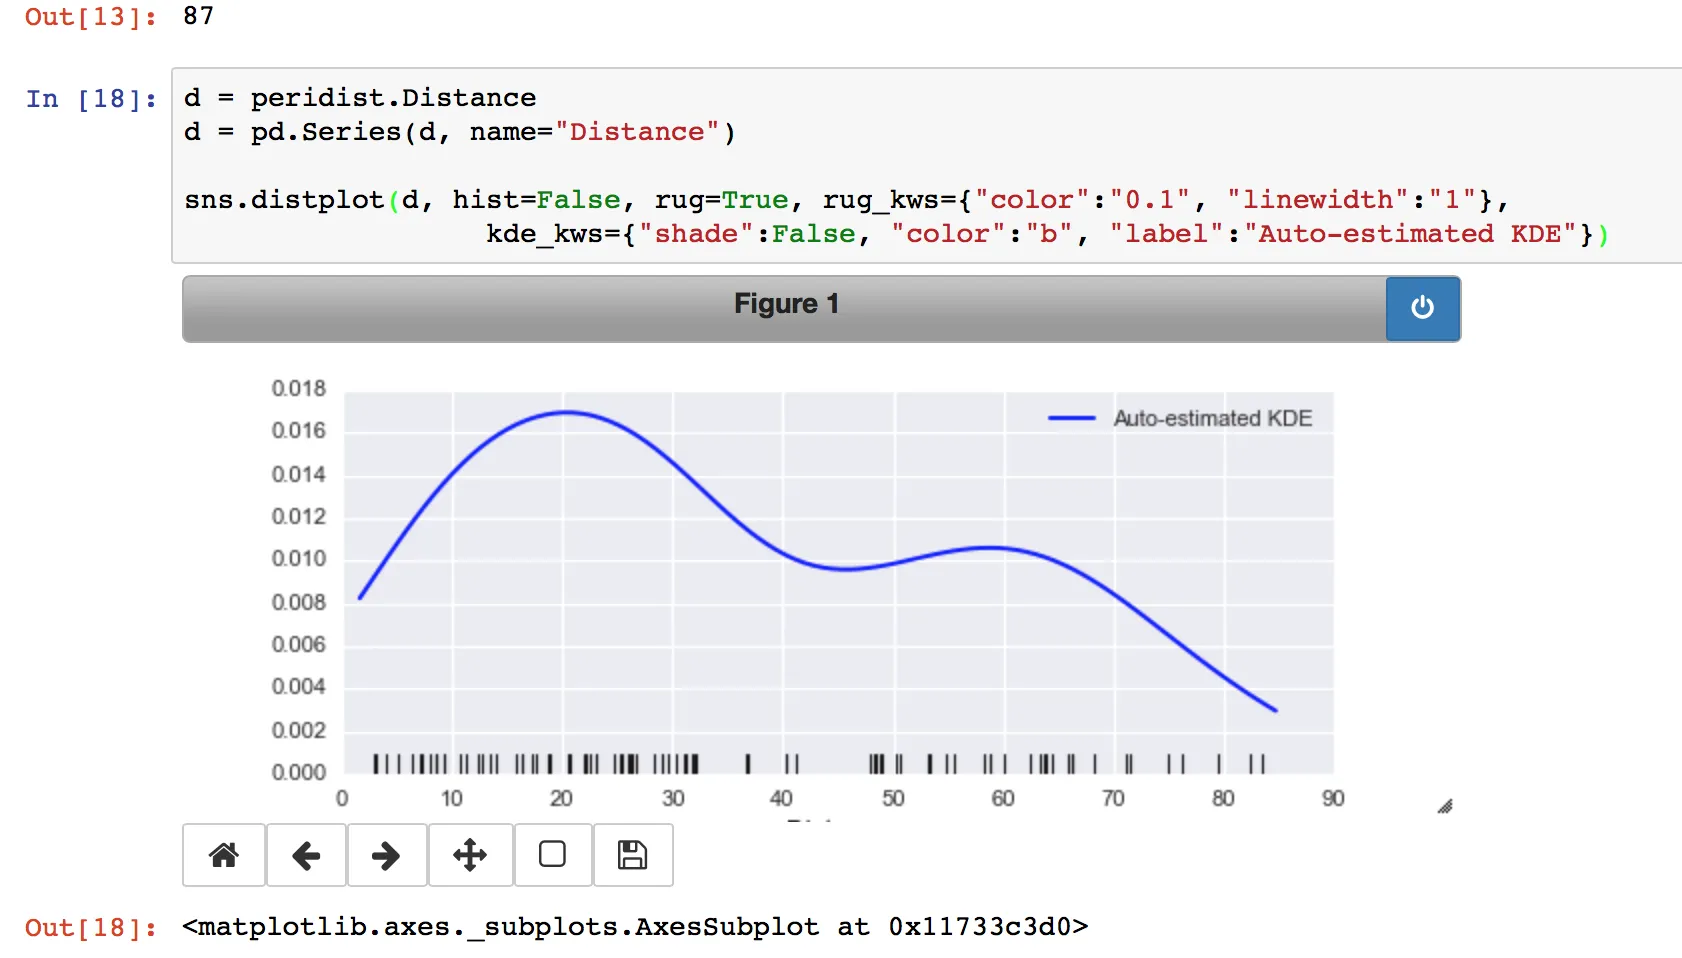
当我制作多个图表时,在运行另一个图表之前,我必须手动按下每个图表上的“停止交互”按钮,否则最新的图表将叠加在先前的图表上。
我认为问题在于我没有指定每个图表都需要新的图形?但我不知道如何最好地解决这个问题!
难道每次都要写plt.figure吗?这似乎不太可能……?
提前感谢您的帮助!
我在Jupyter Notebook中的一行代码中使用 %matplotlib notebook。
当我制作多个图表时,在运行另一个图表之前,我必须手动按下每个图表上的“停止交互”按钮,否则最新的图表将叠加在先前的图表上。
我认为问题在于我没有指定每个图表都需要新的图形?但我不知道如何最好地解决这个问题!
难道每次都要写plt.figure吗?这似乎不太可能……?
提前感谢您的帮助!
在Notebook中,您需要在导入pyplot之后添加plt.ioff。
这是笔记本顶部的一段代码片段,对我而言可以使其正常工作。我曾经遇到过图形被覆盖的问题。
%matplotlib notebook   # this is to allow the plotting in the notebook

import numpy as np
from scipy.linalg import hadamard
import matplotlib.pyplot as plt

plt.ioff()    # this stops the graphs from overwriting each other
%matplotlib notebook吧?当你想要一个新的图形时,通过plt.figure()创建一个新的图形。在现有绘图中添加/删除线条的能力是笔记本后端的关键功能之一,并将其与其他交互式后端保持一致。 - tacaswell