我可以使用一个简单的测试应用程序来重现这个问题,不需要WatchKit。该应用程序由一个NSTimer组成,每秒打印一次“Timer fired”。(这段代码是100%正确的;)。在手动附加到进程之后,日志中没有任何显示。
据我所知,NSLog输出到stderr,我猜调试器附加不会将stderr重定向到Xcode终端。
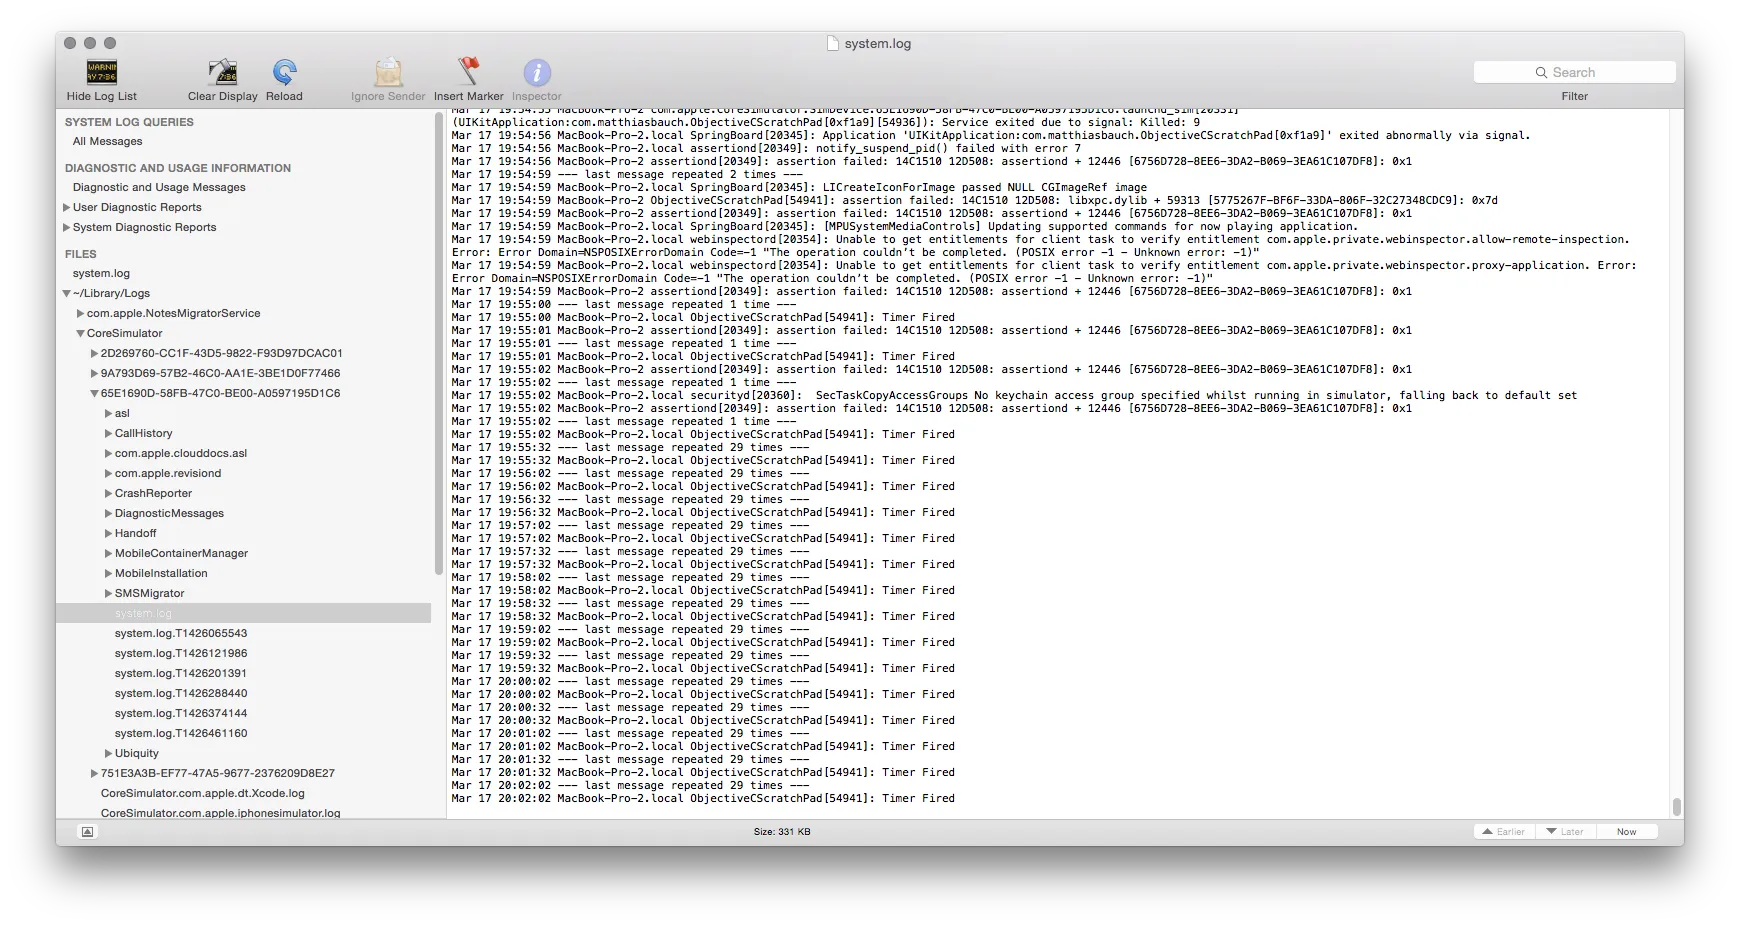
如果您愿意使用控制台应用程序或终端查看日志,您可以这样做。iOS8将模拟器日志存储在
~/Library/Logs/CoreSimulator/<Device-UUID>中。在此目录中,您将找到一个system.log文件,其中包含所有的
NSLog输出。
您可以在终端中查看它(使用
cat、
grep、
tail),或者在Console.app中打开它。
苹果确认在技术笔记TN2239:iOS调试魔法中(至少对于GDB)。
控制台输出
许多程序,甚至许多系统框架,都会将调试消息打印到stderr。此输出的目标最终由程序控制:它可以将stderr重定向到任何选择的目标。然而,在大多数情况下,程序不会重定向stderr,因此输出将进入从启动环境中继承的默认目标。这通常是以下之一:
- 如果您像普通用户一样启动GUI应用程序,则系统会将stderr上打印的任何消息重定向到系统日志。您可以使用前面描述的技术查看这些消息。
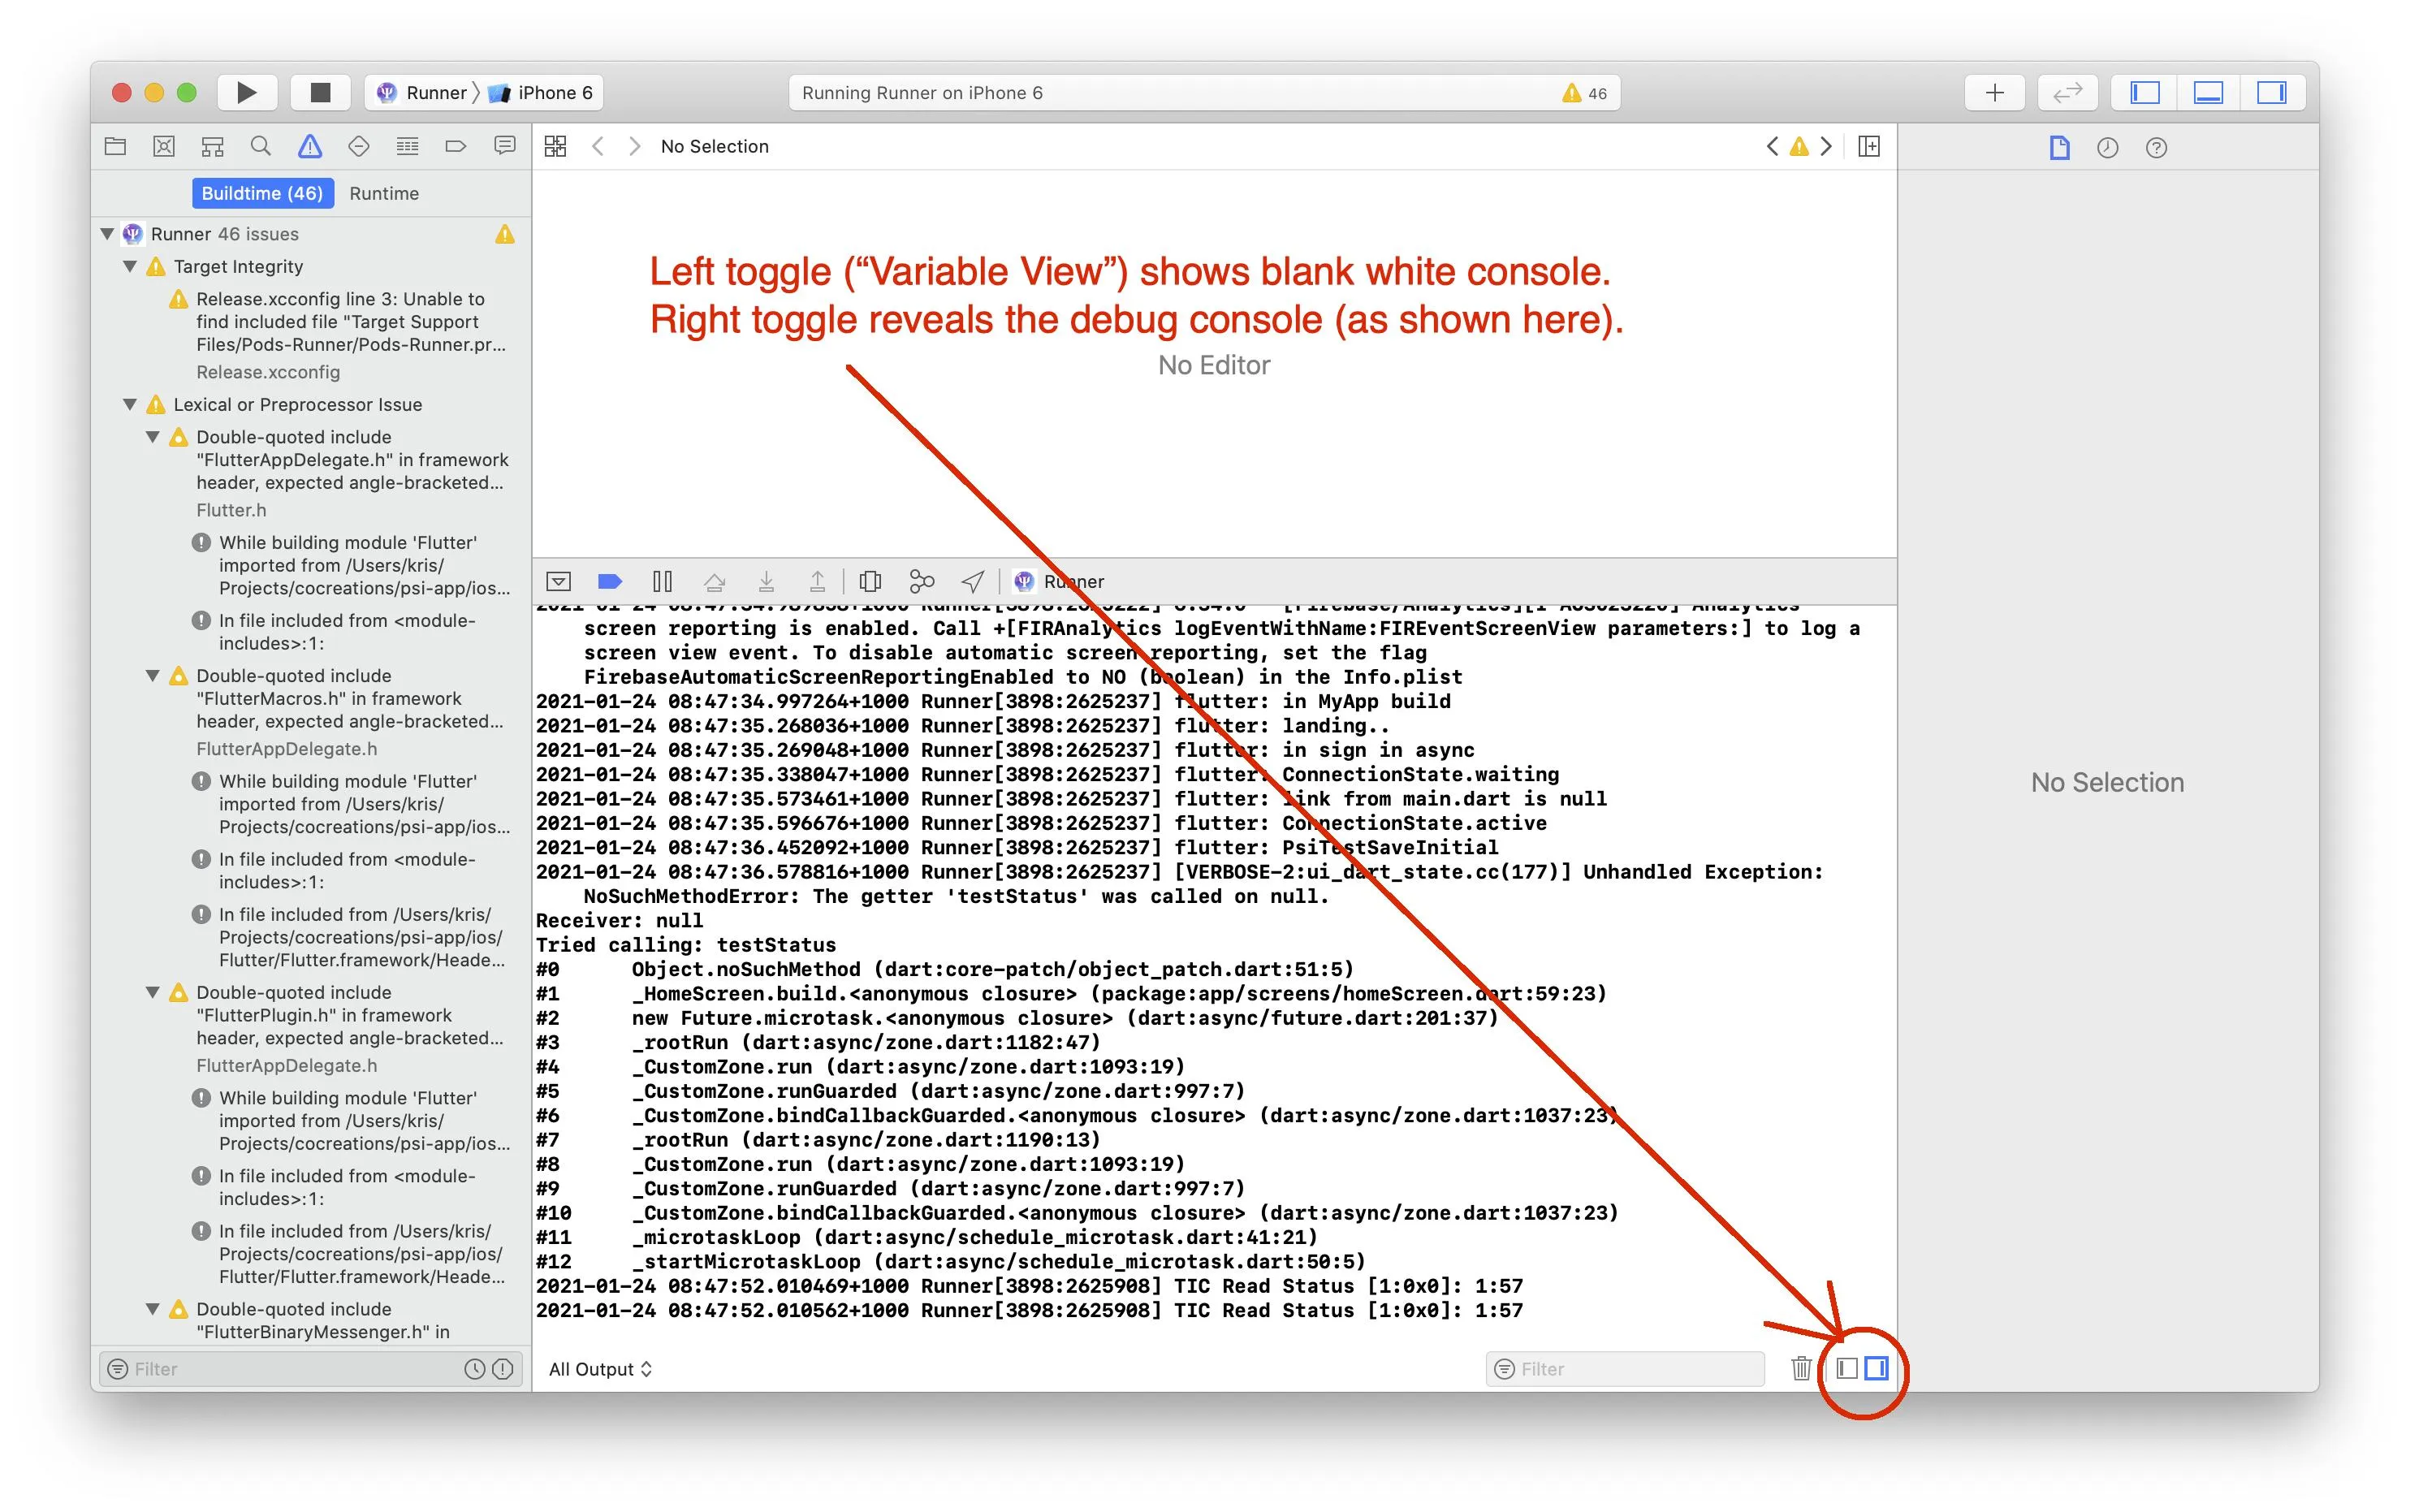
- 如果您在Xcode内运行程序,则可以在Xcode的调试器控制台窗口中看到其stderr输出(从“运行”菜单中选择“控制台”菜单项即可查看此窗口)。
附加到运行中的程序(使用Xcode的“附加到进程”菜单或GDB中的attach命令)不会自动将程序的stderr连接到您的GDB窗口。您可以使用Technical Note TN2030,“GDB for MacsBug Veterans”中“连接后查看stdout和stderr”部分中描述的技巧在GDB内完成此操作。
提到的TN2030已不再他们的服务器上可用(
mirror)。它展示了如何将stdout和stderr重定向到Xcode控制台。然而,由于
shell tty不是LLDB的有效命令,它并没有太大帮助。但也许有一种不同的方法可以访问tty Xcodes控制台使用,因此我附上了该TN的重要部分。
Seeing stdout and stderr After Attaching
If you attach GDB to a process (as opposed to starting the process
from within GDB), you won't be able to see anything that the process
prints to stdout or stderr. Programs launched by the Finder typically
have stdout and stderr connected to "/dev/console", so the information
they print goes to the console. You can view this by launching the
Console application (in the Utilities folder), however, it's
inconvenient to have to look in a separate window. Another alternative
is to connect the process's stdout or stderr to the terminal device
for GDB's Terminal window. Listing 9 shows how to do this.
Listing 9. Connecting stdout and stderr to GDB's terminal device.
(gdb) attach 795
[... output omitted ...]
(gdb) call (void) DebugPrintMenuList()
 No output )-:

 Close the stdout and stderr file descriptors.
(gdb) call (void) close(1)
(gdb) call (void) close(2)

 Determine the name of the terminal device for GDB itself.
(gdb) shell tty
/dev/ttyp1

 Reopen stdout and stderr, but connected to GDB's terminal.
 The function results should be 1 and 2; if not, something
 is horribly wrong.
(gdb) call (int) open("/dev/ttyp1", 2, 0)
$1 = 1
(gdb) call (int) open("/dev/ttyp1", 2, 0)
$2 = 2

 Try the DebugPrintMenuList again.
(gdb) call (void) DebugPrintMenuList()
 Yay output!
Index MenuRef     ID  Title
----- ---------- ---- -----
<regular menus>
00001 0x767725D3 -21629 Ed
00002 0x76772627 1128 <Apple>
00003 0x767726CF 1129 File
00004 0x76772567 1130 Edit
[... remaining output omitted ...]