我想创建一个类似于下面的图表,其中蓝色颜色盖过了灰色。然而,在我创建的图表中,蓝色并没有盖过其他颜色。有人能指导我如何实现吗?
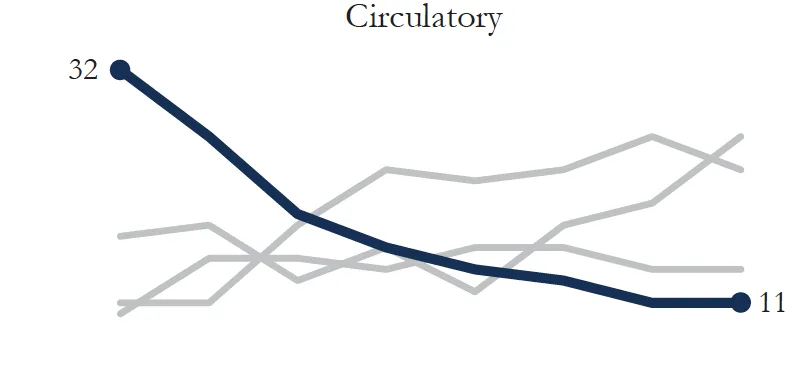
这是我想要在颜色方面得到的图表:
这是我想要在颜色方面得到的图表:
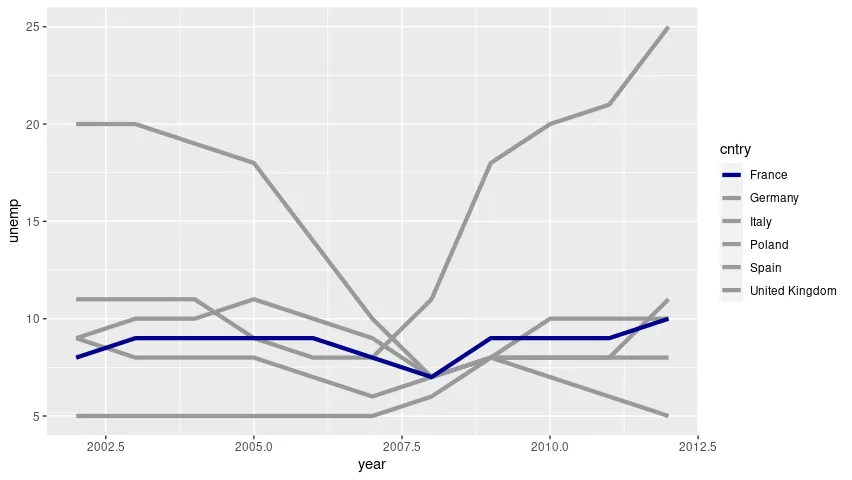
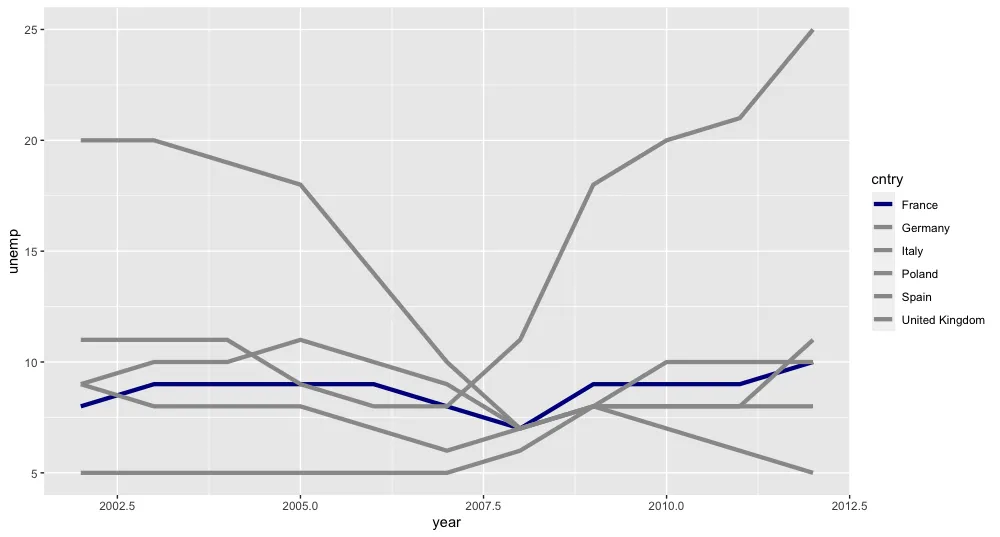
这是我的情节:
  ggplot(df, aes(year, unemp), color=cntry)+
  geom_line(aes(group=cntry, color=cntry), size=1.5)+
  scale_color_manual(values=c('dark blue','#999999','#999999','#999999','#999999','#999999'))
这是我的数据:
   df= structure(list(cntry = structure(c(1L, 1L, 1L, 1L, 1L, 1L, 1L,
1L, 1L, 1L, 1L, 2L, 2L, 2L, 2L, 2L, 2L, 2L, 2L, 2L, 2L, 2L, 3L,
3L, 3L, 3L, 3L, 3L, 3L, 3L, 3L, 3L, 3L, 4L, 4L, 4L, 4L, 4L, 4L,
4L, 4L, 4L, 4L, 4L, 5L, 5L, 5L, 5L, 5L, 5L, 5L, 5L, 5L, 5L, 5L,
6L, 6L, 6L, 6L, 6L, 6L, 6L, 6L, 6L, 6L, 6L), .Label = c("France",
"Germany", "Italy", "Poland", "Spain", "United Kingdom"), class = "factor"),
    year = c(2002, 2003, 2004, 2005, 2006, 2007, 2008, 2009,
    2010, 2011, 2012, 2002, 2003, 2004, 2005, 2006, 2007, 2008,
    2009, 2010, 2011, 2012, 2002, 2003, 2004, 2005, 2006, 2007,
    2008, 2009, 2010, 2011, 2012, 2002, 2003, 2004, 2005, 2006,
    2007, 2008, 2009, 2010, 2011, 2012, 2002, 2003, 2004, 2005,
    2006, 2007, 2008, 2009, 2010, 2011, 2012, 2002, 2003, 2004,
    2005, 2006, 2007, 2008, 2009, 2010, 2011, 2012), unemp = c(8,
    9, 9, 9, 9, 8, 7, 9, 9, 9, 10, 9, 10, 10, 11, 10, 9, 7, 8,
    7, 6, 5, 9, 8, 8, 8, 7, 6, 7, 8, 8, 8, 11, 20, 20, 19, 18,
    14, 10, 7, 8, 10, 10, 10, 11, 11, 11, 9, 8, 8, 11, 18, 20,
    21, 25, 5, 5, 5, 5, 5, 5, 6, 8, 8, 8, 8)), row.names = c(NA,
-66L), class = c("tbl_df", "tbl", "data.frame"))