我正在使用flot来显示条形图。当我将tickLength设置为0时,它会隐藏垂直和水平线,但它也会隐藏x轴和y轴线。我需要x轴和y轴而没有垂直和水平网格线。有什么办法可以做到这一点吗?
请参见图像中的第二个图表。那就是我想要的。
请参见图像中的第二个图表。那就是我想要的。
这比我想象的要棘手。我能想到的唯一办法是禁用边框和轴线,然后手动将其添加回来:
$(function() {
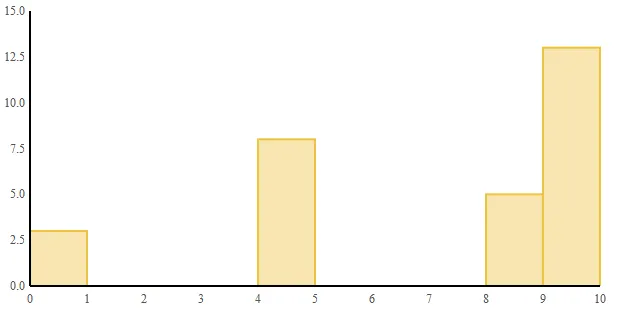
var d2 = [[0, 3], [4, 8], [8, 5], [9, 13]];
$.plot($("#placeholder"),
[{data: d2,
bars: {
show: true
}}
],
{
xaxis: {
tickLength: 0
},
yaxis: {
tickLength: 0
},
grid: {
borderWidth: 0,
aboveData: true,
markings: [ { xaxis: { from: 0, to: 10 }, yaxis: { from: 0, to: 0 }, color: "#000" },
{ xaxis: { from: 0, to: 0 }, yaxis: { from: 0, to: 15 }, color: "#000" }]
}
}
);
});
生成:
Mark的答案可行,但是对他的数据来说过于硬编码了。这个稍微好一点:
$(function() {
    var d2 = [[0, 3], [4, 8], [8, 5], [9, 13]];
    $.plot($("#placeholder"),
      [{data: d2,
        bars: {
            show: true
        }}
      ],
      {
        xaxis: {
            tickLength: 0
        },
         yaxis: {
            tickLength: 0
        },
        grid: {
           borderWidth: 0,
           aboveData: true,
           markings: [ { yaxis: { from: 0, to: 0 }, color: "#000" },
                       { xaxis: { from: 0, to: 0 }, color: "#000" }]
        }
      }
    );
});
设置
xaxis:{ tickLength:0 },yaxis:{ tickLength:0 }
也会隐藏网格线。
对于(0,0)原点的情况,您可以通过绘制底部和左侧边框线来模拟坐标轴:
grid: {
    borderColor: 'black',
    borderWidth: {
        top: 0,
        right: 0,
        bottom: 2,
        left: 2
    },
    ...
}
尝试将行颜色设置为白色(或您的背景颜色)
 yaxis:
  . . .
  tickColor: "#cccccc" /* or better "#ffffff" */
  . . .