如何在Bokeh中为一条线阴影区域添加色彩?
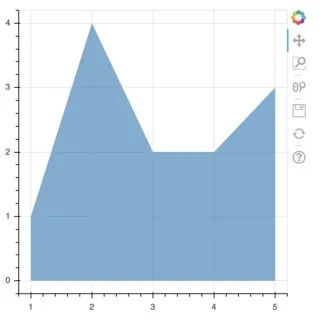
我有一个简单的线性图,想要在指定的颜色下填充线条下方的区域。
import pandas as pd
from bokeh.io import output_file, curdoc
from bokeh.plotting import figure, show
from bokeh.models import ColumnDataSource
output_file("layout.html")
df = pd.DataFrame({'date': ["1-1-2019", "2-1-2019", "3-1-2019", "4-1-2019", "5-1-2019", "6-1-2019", "7-1-2019", "8-1-2019", "9-1-2019", "10-1-2019"],
'cost': [10, 15, 20, 30, 25, 5, 15, 30, 35, 25]})
fig = figure(x_axis_type="datetime", toolbar_location='above', plot_width=1500)
plot_source = ColumnDataSource(data=dict(date=pd.to_datetime(df["date"]),
cost=df["cost"]))
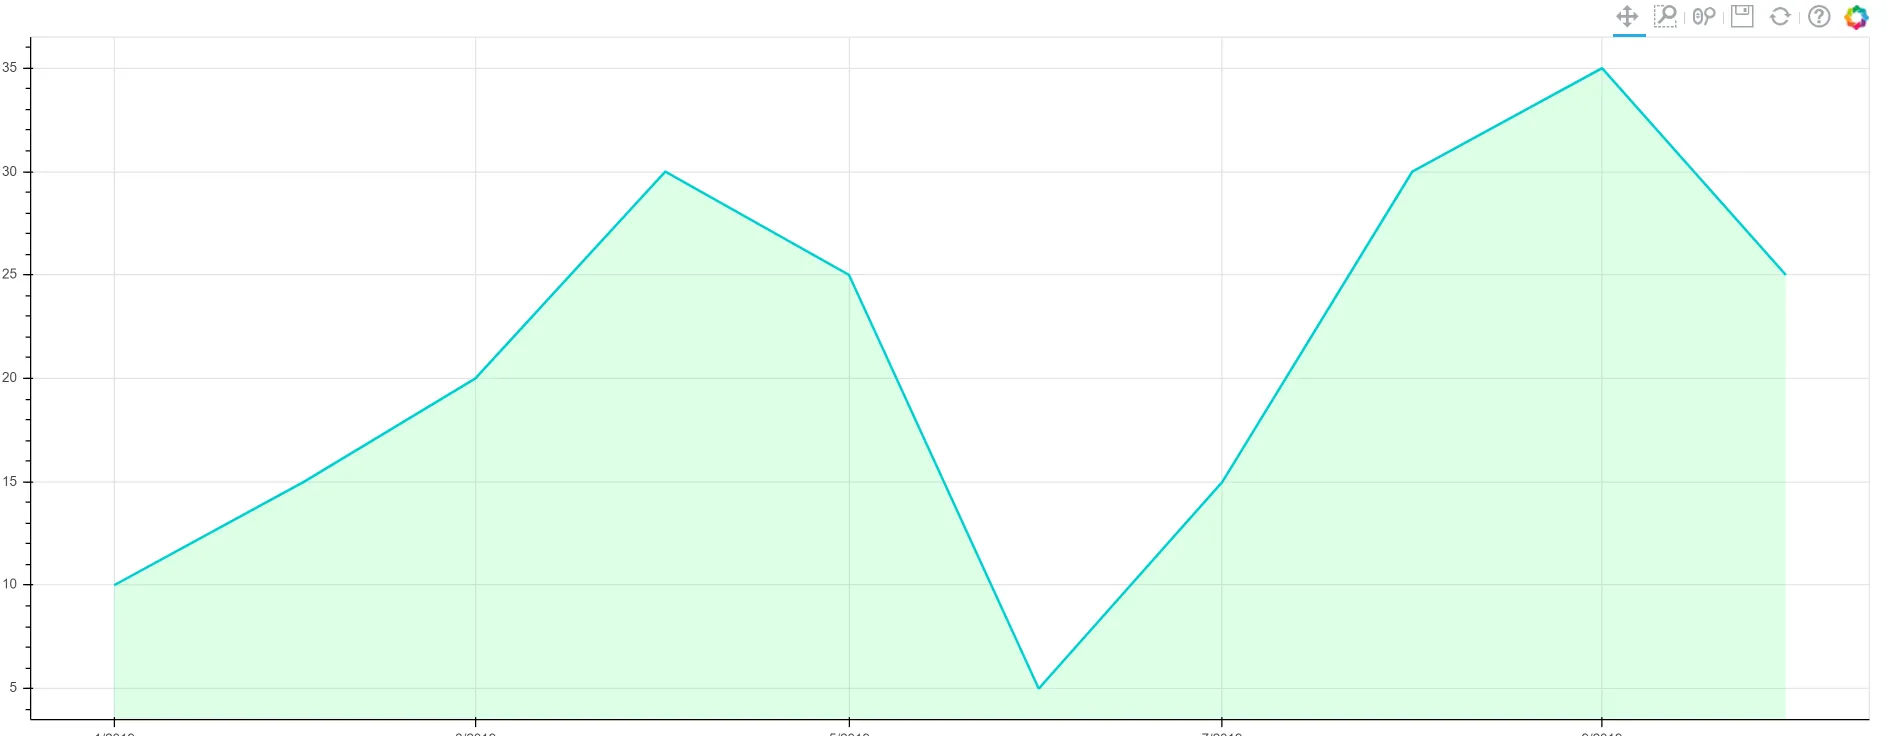
line_plot = fig.line("date", "cost", source=plot_source, line_width=2, color="#00CED1")
show(fig)
因此,它在下面的图像中看起来像一个绿色区域。
我检查了Pathces字形函数,但我不清楚它的含义。感谢任何帮助!