这是一个很老的问题,但我仍然觉得它很有趣。
在WPF中,最好使用库(例如OxyPlot)来完成此操作。它具有MIT许可证,由于其灵活的许可证,可以在许多项目中使用。
首先,在WPF应用程序的项目文件中添加这两个Nuget包:
   <ItemGroup>
    <PackageReference Include="OxyPlot.Core" Version="2.1.0" />
    <PackageReference Include="OxyPlot.Wpf" Version="2.1.0" />
  </ItemGroup>
在MainWindow.xaml中添加以下标记,这是一个极简示例:
<Window x:Class="OxyplotGraph.MainWindow"
        xmlns="http://schemas.microsoft.com/winfx/2006/xaml/presentation"
        xmlns:x="http://schemas.microsoft.com/winfx/2006/xaml"
        xmlns:d="http://schemas.microsoft.com/expression/blend/2008"
        xmlns:oxy="http://oxyplot.org/wpf"
        xmlns:mc="http://schemas.openxmlformats.org/markup-compatibility/2006"
        xmlns:local="clr-namespace:OxyplotGraph"
        mc:Ignorable="d"
        Title="MainWindow" Height="450" Width="800">
    <Grid>
        <oxy:PlotView x:Name="PlotView" Grid.Row="0" Grid.Column="0"  Model="{Binding GraphModel}">
        </oxy:PlotView>
    </Grid>
</Window>
我们的代码中也有一些在后台运行的代码。当然,我们可以在这里坚持更多的MVVM模式,但我保持简单。
using OxyPlot;
using OxyPlot.Axes;
using OxyPlot.Series;
using System;
using System.Collections.Generic;
using System.Linq;
using System.Text;
using System.Threading.Tasks;
using System.Windows;
using System.Windows.Controls;
using System.Windows.Data;
using System.Windows.Documents;
using System.Windows.Input;
using System.Windows.Media;
using System.Windows.Media.Imaging;
using System.Windows.Navigation;
using System.Windows.Shapes;
namespace OxyplotGraph
{
public partial class MainWindow : Window
{
public MainWindow()
{
InitializeComponent();
GraphModel = CreatePlotModel();
this.DataContext = this;
}
public PlotModel GraphModel { get; set; }
private PlotModel CreatePlotModel()
{
var plotModel = new PlotModel();
var verticalAxis = new LinearAxis { Position = AxisPosition.Left, Minimum = -10, Maximum = 10 };
plotModel.Series.Add(new FunctionSeries(x => 3*x*x, -10, 10, 0.1));
return plotModel;
}
}
}
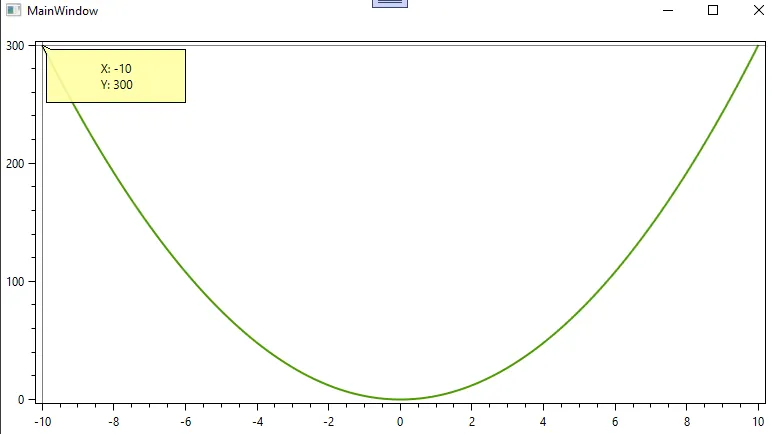
运行此代码,我们可以得到你所说的函数 f(x) = 3*x^2 的图形。我已经与 Google 内置的绘图函数进行了比较,看起来还不错。
可能还有许多其他库可用,包括非商业和商业库,具有更高级的绘制图形功能,但对于你谦虚的场景 - 我想 Oxyplot 应该足以用于演示。它还具有沿着图形跟踪 X 和 Y 轴值时显示值的好功能。