如何使用Python中的networkX包显示二分图?

6
如何在Python的networkX包中显示一个二分图,其中一类节点在左侧列中,另一类在右侧?
我可以创建一个图像并像这样显示它。
B = nx.Graph()
B.add_nodes_from([1,2,3,4], bipartite=0) # Add the node attribute "bipartite"
B.add_nodes_from(['a','b','c'], bipartite=1)
B.add_edges_from([(1,'a'), (1,'b'), (2,'b'), (2,'c'), (3,'c'), (4,'a')])
nx.draw(B)
plt.show()

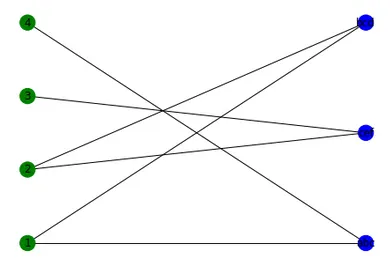
但我希望将节点1、2、3、4放在左侧一列,将节点'a'、'b'、'c'放在右侧一列,并在它们之间建立连线。

3个回答

9

您需要自行设置每个节点的位置:

B = nx.Graph()
B.add_nodes_from([1,2,3,4], bipartite=0) # Add the node attribute "bipartite"
B.add_nodes_from(['a','b','c'], bipartite=1)
B.add_edges_from([(1,'a'), (1,'b'), (2,'b'), (2,'c'), (3,'c'), (4,'a')])

# Separate by group
l, r = nx.bipartite.sets(B)
pos = {}

# Update position for node from each group
pos.update((node, (1, index)) for index, node in enumerate(l))
pos.update((node, (2, index)) for index, node in enumerate(r))

nx.draw(B, pos=pos)
plt.show()

enter image description here


1
这很棒。有没有想法如何将其扩展到多方图,例如有三列?看起来双部分对象限制了您只能使用两个。 - James A. Foster
如何添加节点标签? 编辑:我自己找到了答案,只需在 nx.draw(B, pos=pos) 中添加with_labels=True即可。 - Tobias P. G.

5

在 @Rikka 的回答基础上,结合较新版本的NetworkX,以下代码自动化(并优化了)双部分网络的定位。我还为网络的不同部分添加了标签和不同的颜色。

B = networkx.Graph()
B.add_nodes_from([1,2,3,4], bipartite=0) # Add the node attribute "bipartite"
B.add_nodes_from(['abc','bcd','cef'], bipartite=1)
B.add_edges_from([(1,'abc'), (1,'bcd'), (2,'bcd'), (2,'cef'), (3,'cef'), (4,'abc')])

top = networkx.bipartite.sets(B)[0]
pos = networkx.bipartite_layout(B, top)
networkx.draw(B, pos=pos, with_labels=True, node_color=['green','green','green','green','blue','blue','blue'])
plt.show()

Bipartite network


1
这是当前版本的networkx的最佳答案。 - Erel Segal-Halevi

0
回答自己的问题,基于@Rikka的建议 - 这里是代码,用于确定任意多部分图中节点的位置,给出各部分的名称。
import networkx as nx
def position_MultiPartiteGraph( Graph, Parts ):
    # Graph is a networkX Graph object, where the nodes have attribute 'agentType' with part name as a value
    # Parts is a list of names for the parts (to be shown as columns)
    # returns list of dictionaries with keys being networkX Nodes, values being x,y coordinates for plottingxPos = {}
    xPos = {}
    yPos = {}
    for index1, agentType in enumerate(Parts):
        xPos[agentType] = index1
        yPos[agentType] = 0

    pos = {}
    for node, attrDict in Graph.nodes(data=True):
        agentType = attrDict['agentType']
        # print ('node: %s\tagentType: %s' % (node, agentType))
        # print ('\t(x,y): (%d,%d)' % (xPos[agentType], yPos[agentType]))
        pos[node] = (xPos[agentType], yPos[agentType])
        yPos[agentType] += 1

    return pos

现在,假设我像这样定义了一个三分图(权重对于此示例无关紧要):

TG = nx.Graph()
TG.add_nodes_from([1,2,3,4], agentType='world') # Add the node attribute   "bipartite"
TG.add_nodes_from(['a','b','c'], agentType='sender')
TG.add_nodes_from(['A','B','C'], agentType='receiver')

# This is just an easier way to add (and to automatically generate) weighted edges
myEdges = [(1,'a',0.75),
       (1,'b',0.25),
       (2,'b',0.5),
       (2,'c',0.5),
       (3,'c',1.0),
       (4,'a',1.0),
       ('a','C',0.10),
       ('a','A',0.80),
       ('c','A',1.0),
       ('b','C',1.0)]

[TG.add_edge(x,y,weight=z) for x,y, z in myEdges]

那么这里是如何使用它的:

nx.draw(TG,pos=position_MultiPartiteGraph(TG, ['world', 'sender', 'receiver']))
plt.show()

我不确定如何显示输出,但对我来说它有效!万岁!感谢 @Rikka!


这真是太棒了!您知道如何将不同的列绕成圆形,以便实现同心布局吗?(类似于这个 - Tropilio

网页内容由stack overflow 提供, 点击上面的
可以查看英文原文,
原文链接