我正在尝试使用在https://www.latex-tutorial.com/tutorials/figures/上展示的subfigure方法制作并排图,但是我似乎无法调整大小并让它们并排显示...我做错了什么吗? 以下是我正在使用的代码
\begin{figure}
\centering
\begin{subfigure}[b!]{0.3\textwidth}
\begin{tikzpicture}
\begin{axis}[
axis y line = middle,
axis x line = middle,
xlabel = $x$,
ylabel = {$f(x) = x^3$},
grid=major,
]
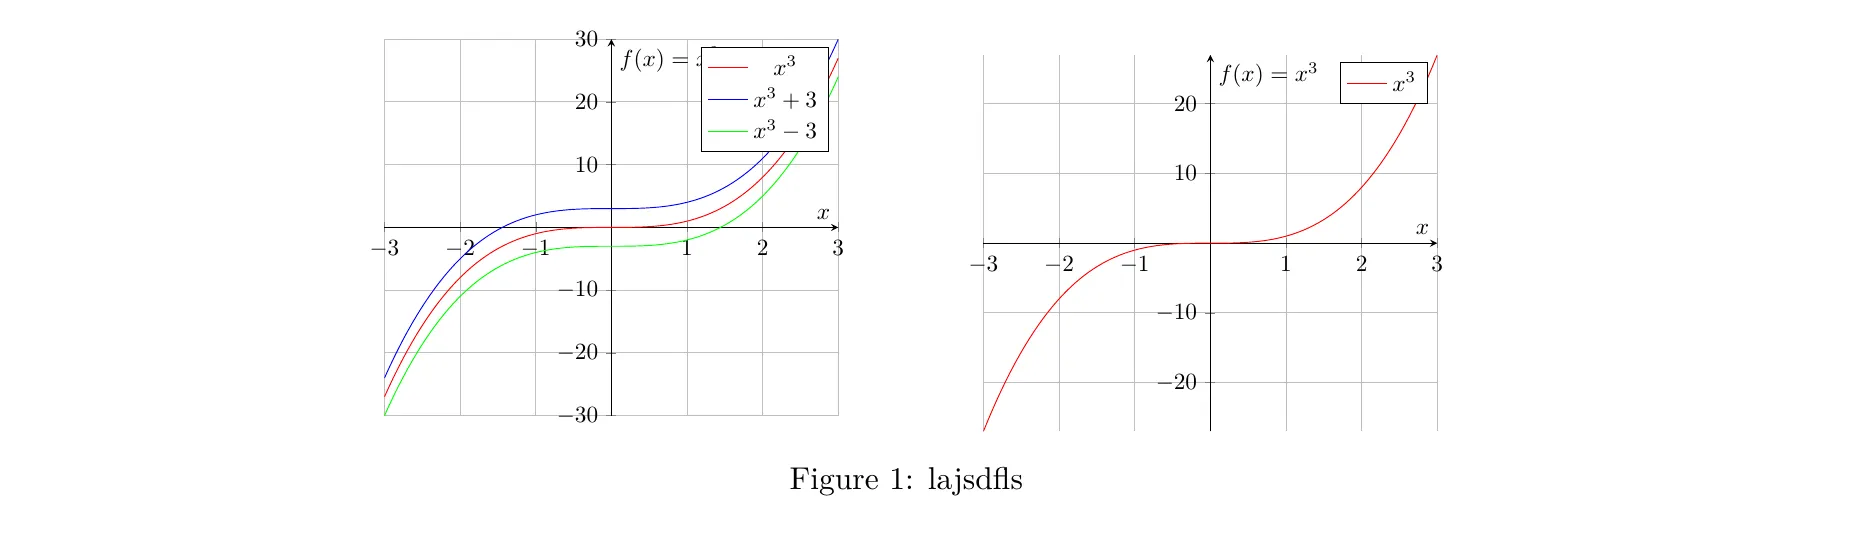
\addplot [
domain=-3:3,
samples=100,
color=red,
]
{x^3};
\addlegendentry{$x^3$}
%
\addplot [
domain=-3:3,
samples=100,
color=blue,
]
{x^3 + 3};
\addlegendentry{$x^3 + 3$}
%
\addplot [
domain=-3:3,
samples=100,
color=green,
]
{x^3 - 3};
\addlegendentry{$x^3 - 3$}
\end{axis}
\end{tikzpicture}
\end{subfigure}
%\hfill
\begin{subfigure}[b]{0.3\textwidth}
\begin{tikzpicture}
\begin{axis}[
axis y line = middle,
axis x line = middle,
xlabel = $x$,
ylabel = {$f(x) = x^3$},
grid=major,
]
\addplot [
domain=-3:3,
samples=100,
color=red,
]
{x^3};
\addlegendentry{$x^3$}
\end{axis}
\end{tikzpicture}
\end{subfigure}
\caption{lajsdfls}
\end{figure}