我正在使用ggplot创建箱线图,并希望表示每个箱子所贡献的样本量。在基本的
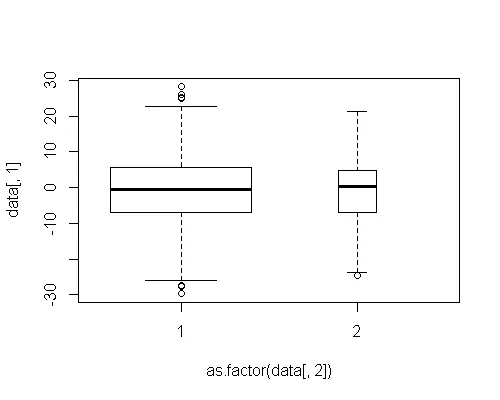
例如,在基本绘图中:
plot函数中,有一个varwidth选项。在ggplot中有相应的等效选项吗?例如,在基本绘图中:
data <- data.frame(rbind(cbind(rnorm(700, 0,10), rep("1",700)),
                         cbind(rnorm(50, 0,10), rep("2",50))))
data[ ,1] <- as.numeric(as.character(data[,1]))
plot(data[,1] ~ as.factor(data[,2]), varwidth = TRUE)
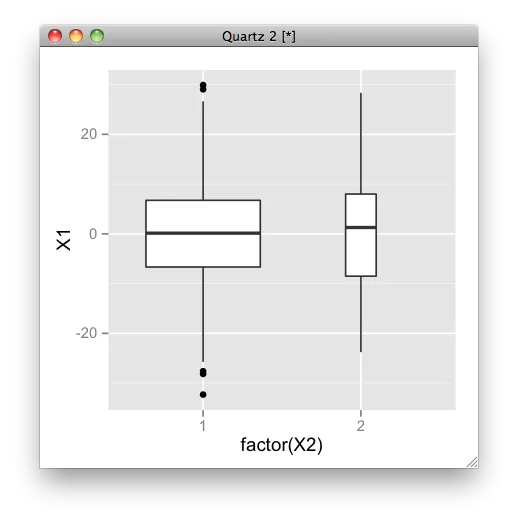
varwidth参数实现了这一点。请参见此问题:https://dev59.com/BYLba4cB1Zd3GeqPbz-Q - Cotton.Rockwood