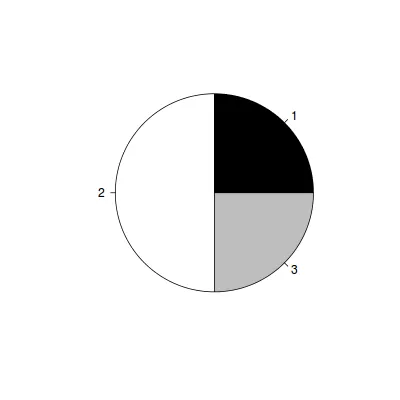
我有这个饼图。
pie(c(1,2,1),col=c("black","white","gray"))

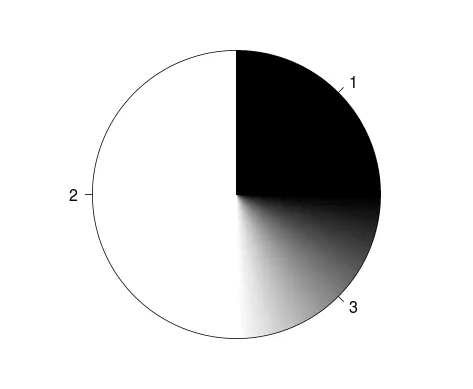
# Number of intervals to subdivide - increase for finer detail
n <- 41
# Generate colours
cols <- colorRampPalette(c("white", "black"))(n)

# Plot
# lty=0 removes the section lines, which also removes outer border
pie(c(1,2, rep(1/n, n)), col=c("black","white", cols) , lty=0,
                                    labels=c(1,2, rep("", n/2), 3))

# Add in outer circle back in
# radius=0.8 used as this is the pie default
plotrix::draw.circle( 0,0, 0.8)
这提供了什么?
ggplot2包。x <- c(1,2,1)
labels <- c(1,2,3)
df <- data.frame(x = unlist(mapply(x = x, lab = labels, function(x, lab) rep(lab, times = x))))
pie <- ggplot(df, aes(x = factor(1), fill = factor(x)))
pie <- pie + geom_bar(width = 1)
pie <- pie + coord_polar(theta = "y")
pie <- pie + xlab("") + ylab("")
pie + scale_fill_grey()