Apache Bench Gnuplot输出 - 列定义是什么?

16

我正在使用ApacheBench获取一些基本的时间信息,非常满足我的需求。我注意到"-g file"会创建一个每次调用作为行的制表符分隔文件。然而,我无法确定列的定义。这是我最好的猜测:

starttime: 不言自明,这个调用开始的时间

seconds: 根据数据,我认为这可能是 "starttime " 以不同格式表示

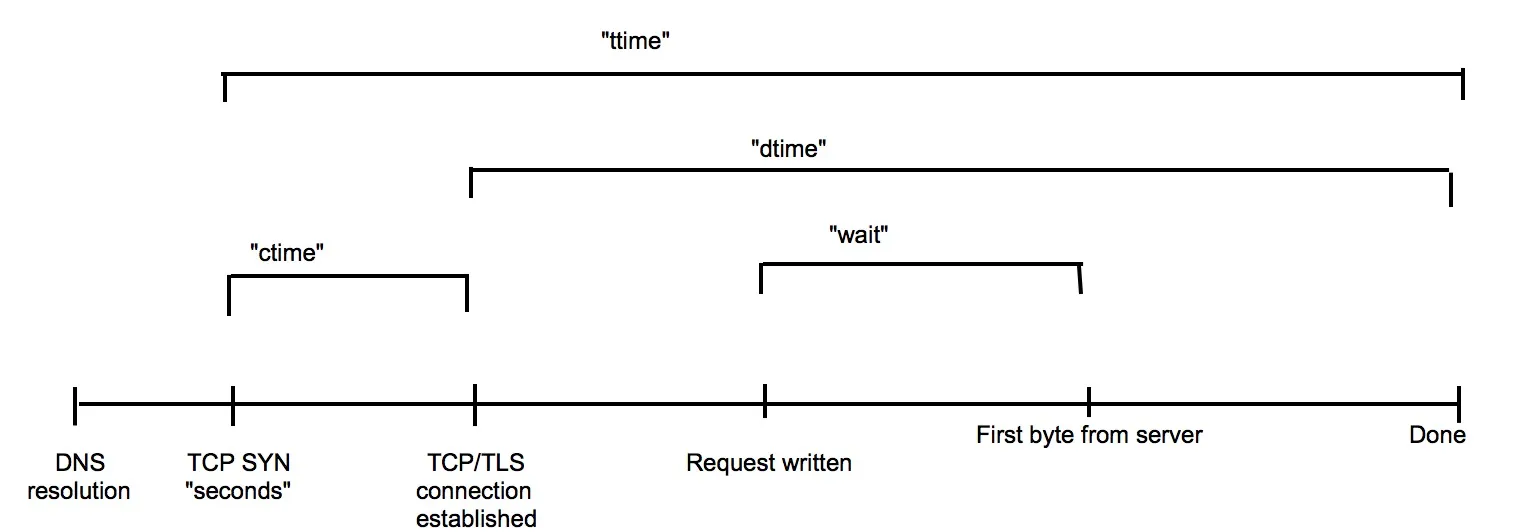
ctime: ? 对于我每行都有一个0值,所以没有头绪

dtime, ttime, wait: dtime或ttime或wait中的任何一个似乎都是“此调用花费的时间(以毫秒为单位)”

AB文档似乎没有涵盖输出格式。是否有人知道这些列的含义,或者我可以在哪里找到一些文档?


1
很想找一些关于Apache Bench的文档!man页面解释了命令行参数,但没有解释输出,让我们去猜测。 - Iain Samuel McLean Elder
3个回答

18

这是我推断出的:

  • ctime:连接时间
  • dtime:处理时间
  • ttime:总时间
  • wait:等待时间

我是如何推断出这些内容的:

$ ab -v 2 -n 1 -c 1 -g output.txt https://dev59.com/_G025IYBdhLWcg3wkG17
This is ApacheBench, Version 2.3 <$Revision: 655654 $>
Copyright 1996 Adam Twiss, Zeus Technology Ltd, http://www.zeustech.net/
Licensed to The Apache Software Foundation, http://www.apache.org/

Benchmarking stackoverflow.com (be patient)...INFO: POST header ==
---
GET /questions/5929104/apache-bench-gnuplot-output-what-are-the-column-definitions HTTP/1.0
Host: stackoverflow.com
User-Agent: ApacheBench/2.3
Accept: */*


---
LOG: header received:
HTTP/1.1 200 OK
Cache-Control: public, max-age=60
Content-Type: text/html; charset=utf-8
Expires: Thu, 26 May 2011 19:24:52 GMT
Last-Modified: Thu, 26 May 2011 19:23:52 GMT
Vary: *
Date: Thu, 26 May 2011 19:23:51 GMT
Connection: close
Content-Length: 29118

<!DOCTYPE HTML PUBLIC "-//W3C//DTD HTML 4.01//EN" "http://www.w3.org/TR/html4/strict.dtd">
<html>
<head>

<title>performance testing - apache bench gnuplot output - what are the column definitions? - Stack Overflow
<link rel="shortcut icon" href="http://cdn.sstatic.net/stackoverflow/img/favicon.ico">
<link rel="apple-touch-icon" href="http://cdn.sstatic.net/stackoverflow/img/apple-touch-icon.png">
<link rel="search" type="application/opensearchdescription+xml" title="Stack Overflow" href="/opensearch.xml
<script type="text/javascript" src="http://ajax.googleapis.com/ajax/libs/jquery/1.5.2/jquery.min.js"></scrip
<script type="text/javascript" src="http://cdn.sstatic.net/js/stub.js?v=005820c36f6e"></script>
<link rel="stylesheet" type="text/css" href="http://cdn.sstatic.net/stackoverflow/all.css?v=d75e6659067e">


    <link rel="canonical" href="https://dev59.com/_G025IYBdhLWcg3wkG17t-
    <link rel="alternate" type="application/atom+xml" title="Feed for question 'apache bench gnuplot output
..done


Server Software:
Server Hostname:        stackoverflow.com
Server Port:            80

Document Path:          /questions/5929104/apache-bench-gnuplot-output-what-are-the-column-definitions
Document Length:        29118 bytes

Concurrency Level:      1
Time taken for tests:   0.330 seconds
Complete requests:      1
Failed requests:        0
Write errors:           0
Total transferred:      29386 bytes
HTML transferred:       29118 bytes
Requests per second:    3.03 [#/sec] (mean)
Time per request:       329.777 [ms] (mean)
Time per request:       329.777 [ms] (mean, across all concurrent requests)
Transfer rate:          87.02 [Kbytes/sec] received

Connection Times (ms)
              min  mean[+/-sd] median   max
Connect:       79   79   0.0     79      79
Processing:   251  251   0.0    251     251
Waiting:       91   91   0.0     91      91
Total:        330  330   0.0    330     330

相比之下:

$ cat output.txt
starttime       seconds ctime   dtime   ttime   wait
Thu May 26 12:24:02 2011        1306437842      79      251     330     91

等待时间是否等于处理时间?那就是等待时间吗? - gavenkoa
对于证明方法的赞同加一!为其他读者补充一下,也可以看看laktak的回答。等待时间(wait)是等待从服务器接收第一个字节的时间。ctime是等待连接完全建立的时间。dtime是处理时间。ttime是包括ctimedtime在内的总时间。 - haxpor

11

这里有一个很好的解释,与此处不同于已接受答案中缺少的wait:

输入图像描述


2

我得出的结论与saltycrane相同,但我想添加一些内容(并且想总结一下):

  • starttime:不言自明,这次调用开始的时间(如问题所述)
  • seconds:以Unix时间戳表示的starttime(date -d @1306437842 返回starttime输出)
  • ctime:连接时间
  • dtime:处理时间
  • ttime:总时间(ttime = ctime + dtime)
  • wait:等待时间

网页内容由stack overflow 提供, 点击上面的
可以查看英文原文,
原文链接