基于@umotto的答案,这里提供一个更为复杂的版本:
import matplotlib as mlib
import matplotlib.pyplot as plt
import numpy as np
def plot_colored_grid(data, colors=['white', 'green'], bounds=[0, 0.5, 1], grid=True, labels=False, frame=True):
"""Plot 2d matrix with grid with well-defined colors for specific boundary values.
:param data: 2d matrix
:param colors: colors
:param bounds: bounds between which the respective color will be plotted
:param grid: whether grid should be plotted
:param labels: whether labels should be plotted
:param frame: whether frame should be plotted
"""
cmap = mplt.colors.ListedColormap(colors)
norm = mplt.colors.BoundaryNorm(bounds, cmap.N)
plt.figure(frameon=frame)
if grid:
plt.grid(axis='both', color='k', linewidth=2)
plt.xticks(np.arange(0.5, data.shape[1], 1))
plt.yticks(np.arange(0.5, data.shape[0], 1))
if not labels:
plt.tick_params(bottom=False, top=False, left=False, right=False, labelbottom=False, labelleft=False)
plt.imshow(data, cmap=cmap, norm=norm)
plt.show()
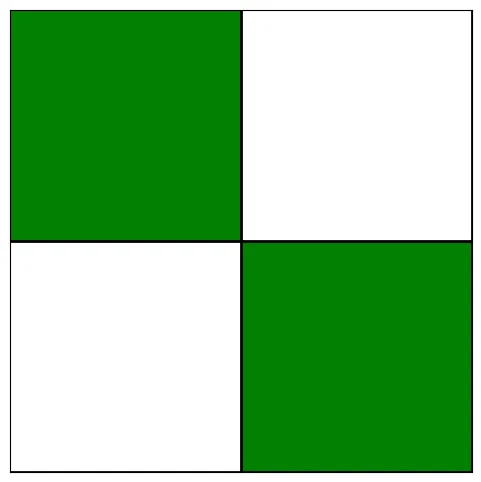
如果您想绘制一个二进制矩阵,例如
plot_colored_grid(np.array([[True, False], [False, True]])),将会得到以下结果:
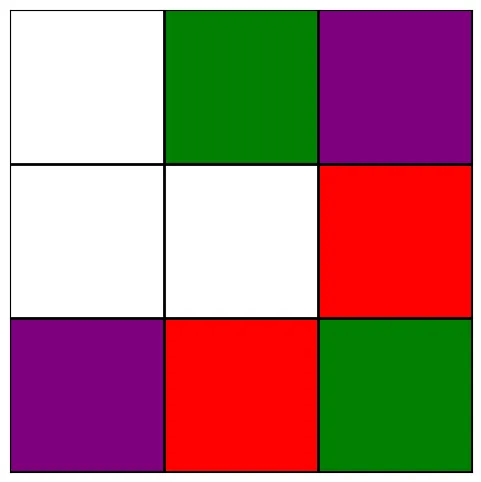
另外一个例子:
data = np.array([
    [9, 12, 24],
    [5, 2, 33],
    [27, 36, 15]
])

plot_colored_grid(data, colors=['white', 'green', 'purple', 'red'], bounds=[0, 10, 20, 30, 40])
这将导致: