如何使用saveas()将MATLAB图形保存为JPEG格式,同时避免图像质量下降?

23
在我编写的MATLAB函数中,我生成了一张图。当执行该函数时,图形将被显示出来。我需要将这个图形保存为JPEG格式的图片。为此,我可以在显示图形的窗口中进行“文件”->“另存为”的操作。但我想自动化这个过程。我尝试使用saveas()函数来实现自动保存,但结果得到的图像不理想。下面是一个演示问题的示例图像,以说明我的意思:
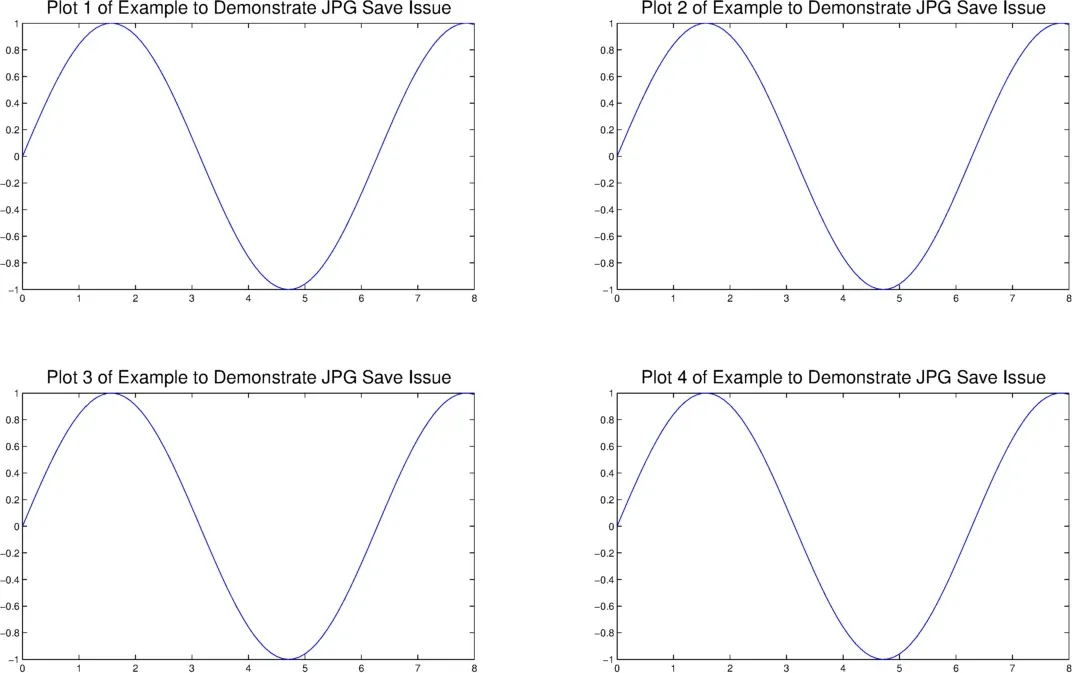
手动使用MATLAB图形窗口中的“文件”->“另存为”保存的JPEG图像: manual file save as jpg rendering 
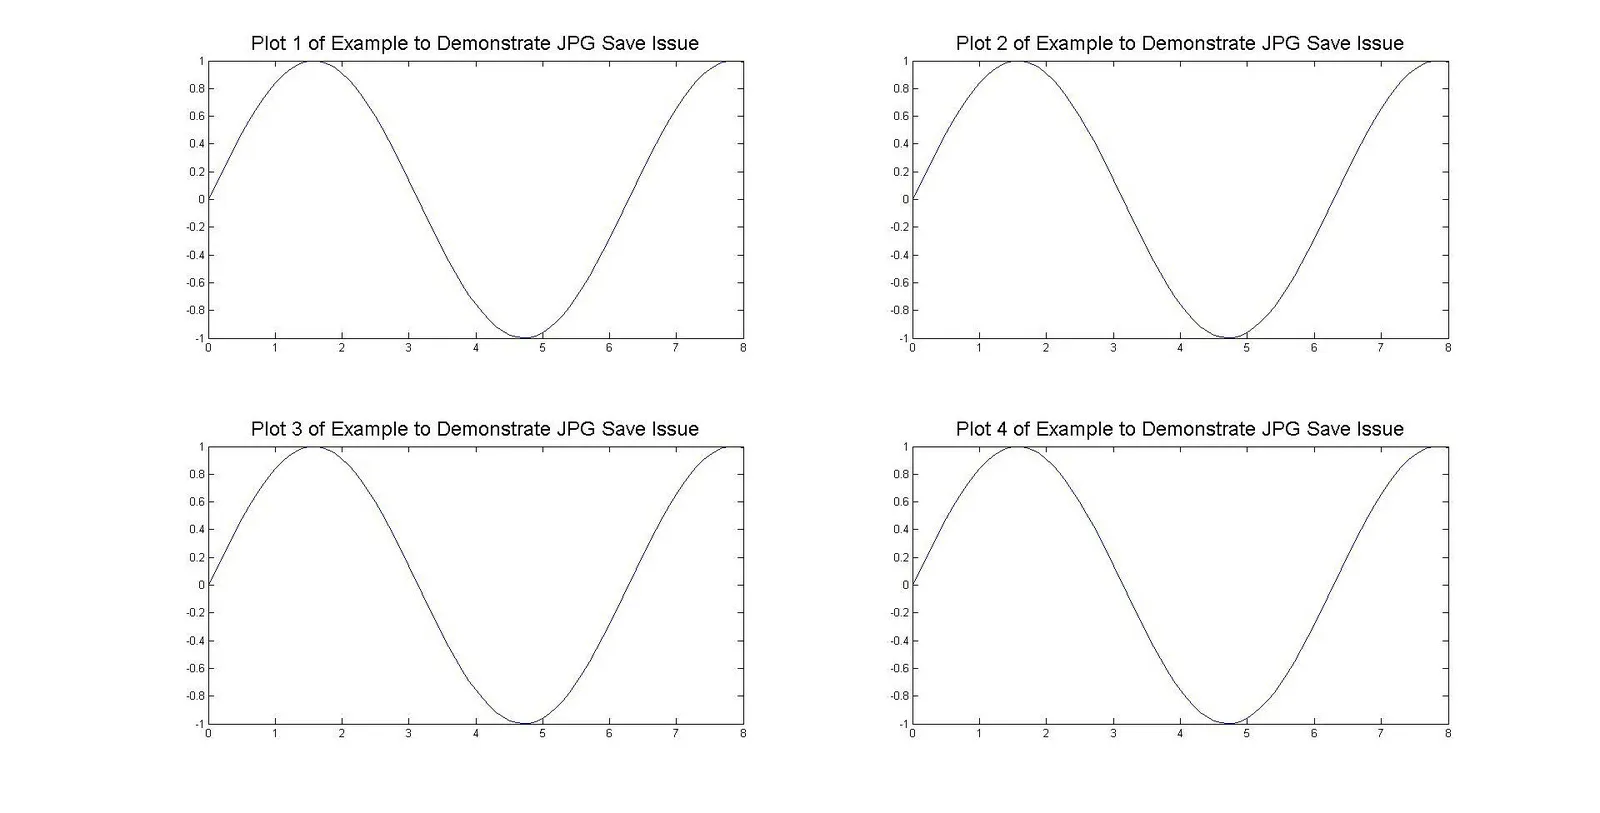
使用saveas()函数保存的JPEG图像(请注意,绘图不那么好看,标题重叠): saveas jpg rendering 
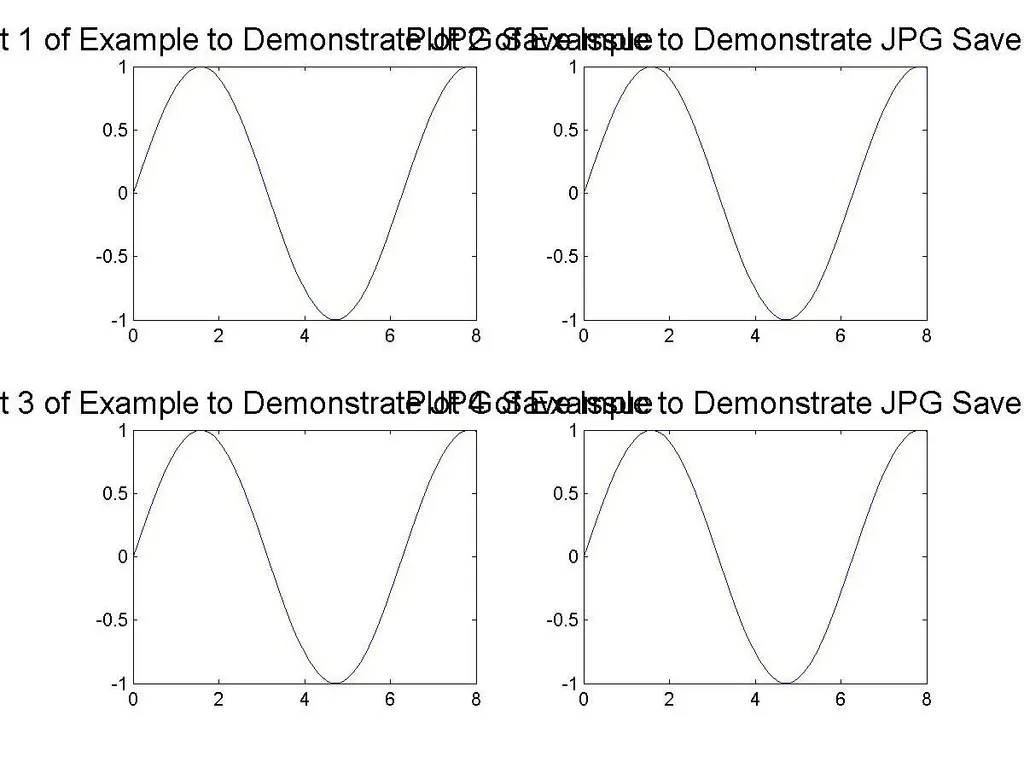
以下是我用来生成图形并使用saveas()函数将其保存为JPEG格式的MATLAB函数:
function JpgSaveIssueDemo( )
    figure( 1 );
    t = 0:0.1:8;    

    subplot( 2, 2, 1 );    
    plot( t, sin(t) );
    title( 'Plot 1 of Example to Demonstrate JPG Save Issue', 'FontSize', 18 );

    subplot( 2, 2, 2 );
    plot( t, sin(t) );
    title( 'Plot 2 of Example to Demonstrate JPG Save Issue', 'FontSize', 18 );

    subplot( 2, 2, 3 );
    plot( t, sin(t) );
    title( 'Plot 3 of Example to Demonstrate JPG Save Issue', 'FontSize', 18 );

    subplot( 2, 2, 4 );
    plot( t, sin(t) );
    title( 'Plot 4 of Example to Demonstrate JPG Save Issue', 'FontSize', 18 );

    saveas( gcf, 'DemoPlot', 'jpg' );
end

当执行JpgSaveIssueDemo()时显示的图形并非最大化。因此,我认为如果在执行saveas()之前在JpgSaveIssueDemo()中使用函数调用/ s来最大化它,则保存的JPEG图像将会很好。因此,在JpgSaveIssueDemo()中的saveas()行之前,我使用了以下代码来最大化该图形:
drawnow;
jFrame = get(handle(gcf),'JavaFrame'); 
jFrame.setMaximized(true);

然后,显示的图像被最大化。 然而,结果是相同的:JPEG图像仍然不理想。

对此应该怎么办?


3
部分解决方案:Jpg格式不适合这种类型的图片。你图片中线附近的垃圾方块是jpg压缩的痕迹。使用jpg格式适合照片等图像,使用png格式适合图表等。Png格式可以提供更好的质量和较小的文件大小。 - mdaoust
3个回答

20

Matlab的图形导出对话框和saveas()函数缺乏许多理想的功能。特别是,savas()无法创建自定义分辨率的图像,这就是为什么你的结果看起来很差的原因。对于位图图像的创建,我强烈推荐使用第三方函数export_fig。通过将以下代码添加到您的函数中(包括最大化技巧),即可实现。

set(gcf, 'Color', 'white'); % white bckgr
export_fig( gcf, ...      % figure handle
    'Export_fig_demo',... % name of output file without extension
    '-painters', ...      % renderer
    '-jpg', ...           % file format
    '-r72' );             % resolution in dpi

我创建了这张图片:(在浏览器中使用“显示图像”或类似功能获取原始尺寸)

image created with export_fig

为了获得更高质量的图像,可以使用150或甚至300 dpi(用于打印)。对于大多数应用程序而言,定义轴大小以获得所需尺寸的图像比最大化图形窗口更合适:

unitSave = get(figureHandle, 'Unit');                % store original unit
set(figureHandle, 'Unit', 'centimeters');            % set unit to cm
set(figureHandle,'position',[0 0 width height]);     % set size
set(figureHandle, 'Unit', unitSave);                 % restore original unit

1
感谢您提供的优秀链接! - Mikhail
1
一个似乎也能解决我的问题的好答案:http://stackoverflow.com/q/22764867/376454 - Wok

4
只需使用像EPS这样的无损可缩放格式,参见下面代码片段中的最后一行 :)
h1=figure % create figure
plot(t,Data,'r');
legend('Myfunction');

% Create title with required font size
title({'Variance vs distance'},'LineWidth',4,'FontSize',18,...
'FontName','Droid Sans');

% Create xlabel with required font size
xlabel({'Distance (cm)'},'FontSize',14,...
'FontName','DejaVu Sans');

% Create ylabel with required font size
ylabel({'Variance of sobel gradients'},'FontSize',14,...
'FontName','DejaVu Sans');

print(h1,'-depsc','autofocus.eps') % print figure to a file

虽然此处不支持附加EPS文件,但它具有可伸缩性,可以放置在文字处理软件或LaTeX中,而无需担心分辨率问题。


1
我曾经遇到同样的问题,以下是我用来解决它的方法:
set(gcf,'PaperPositionMode','auto') saveas(gcf,'file_to_save','png')
其中,gcf 可以被替换为所需图形的句柄。

网页内容由stack overflow 提供, 点击上面的
可以查看英文原文,
原文链接