我希望使用谷歌图表展示一个比例,使用百分数。我知道如何将vAxis更改为百分数:
vAxis: {format:'#%'},
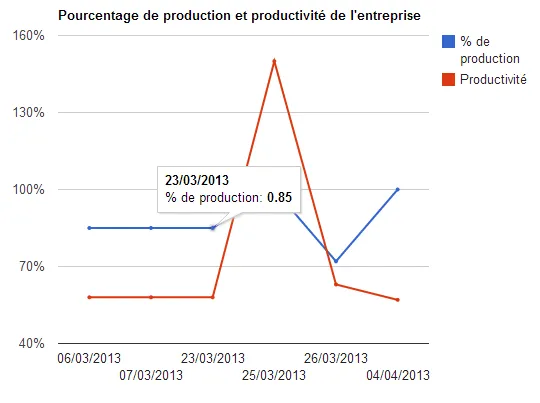
但问题是,我的数据在工具提示中显示的不是百分比,而是十进制值(0.85而不是预期的85%)
以下是我的代码:
  google.load("visualization", "1", {packages:["corechart"]});
        google.setOnLoadCallback(function() {})
        function drawChart(data) {
          var data = google.visualization.arrayToDataTable(data);

          var options = {
            title: "Pourcentage de production et productivité de l'entreprise",
            chartArea: {top:39},
            vAxis: {format:'#%'},
            pointSize:2
          }

          var chart = new google.visualization.LineChart(document.getElementById('chart_div'));
          chart.draw(data, options);
        }

drawChart([['Year', '% de production', 'Productivité'],[ '06/03/2013', 0.85 , 0.58 ],[ '07/03/2013', 0.85 , 0.58 ],[ '23/03/2013', 0.85 , 0.58 ],[ '25/03/2013', 1 , 1.5 ],[ '26/03/2013', 0.72 , 0.63 ],[ '04/04/2013', 1 , 1.57 ]])