PyQt图形线的鼠标坐标

3
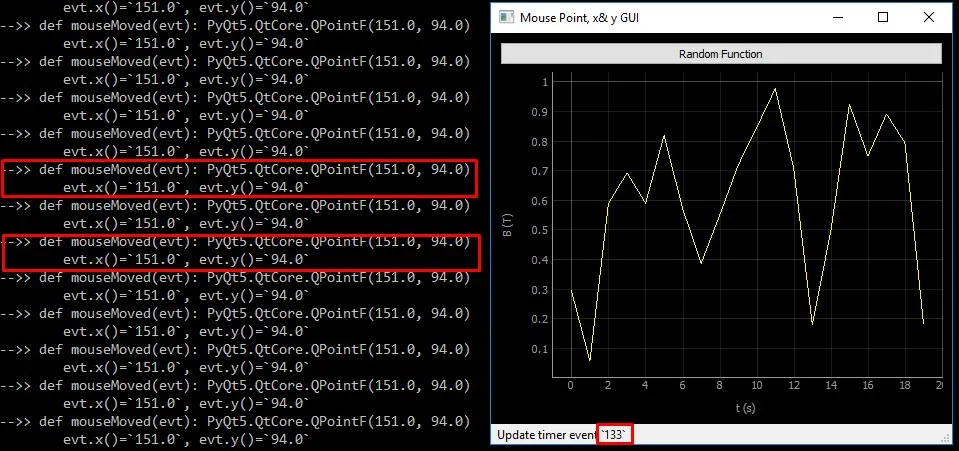
我正在尝试在鼠标移动到图形上方时获取随机函数图的(x,y)值。我使用了pyqtgraph.SignalProxy并将其连接到回调函数mouseMoved。 但是我收到了这个错误: “NameError:全局名称'mouseMoved'未定义” 以下是代码:
import sys
from pyqtgraph.Qt import QtGui, QtCore
import numpy as np
import pyqtgraph as pg
import time
import random

class TestClass(QtGui.QMainWindow):
  #####################################################
  def __init__(self):
    super(TestClass, self).__init__()
    self.initUI()

  #####################################################
  # GUI construction
  def initUI(self):
    win = pg.GraphicsWindow(title="Mouse Point, x & y")

    # creates plot
    self.plot = pg.PlotWidget()
    self.plot.setLabel('left', "B", units='T')
    self.plot.setLabel('bottom', "t", units='s')
    self.plot.showGrid(x=1, y=1, alpha=None)
    self.setCentralWidget(win)
    self.setGeometry(600, 600, 600, 600)
    self.setWindowTitle('Mouse Point, x& y GUI')

    # Create some widgets to be placed inside
    btnRandon = QtGui.QPushButton('Random Function')


    # Create a grid layout to manage the widgets size and position
    layout = QtGui.QGridLayout()
    win.setLayout(layout)

    # Add widgets to the layout in their proper positions
    layout.addWidget(btnRandon, 0, 0) # button to show or hide the OldB
    layout.addWidget(self.plot, 1, 0)

    mypen = pg.mkPen('y', width=1)
    self.curve = self.plot.plot(pen=mypen)

    # Plot
    self.t_plot_max = 30
    self.fe = 10e3
    self.t = np.arange(-1 * self.t_plot_max, 0, 1.0 / self.fe)
    self.len_signal = len(self.t)
    self.signal = np.zeros(self.len_signal, dtype=np.double)

    # status bar
    self.statusBar()

    # clicked button evt
    btnRandon.clicked.connect(self.buttonRandomClicked)

    # show graph
    self.show()

  #####################################################
  def mouseMoved(evt):
    mousePoint = self.curve.vb.mapSceneToView(evt[0])
    label.setText("<span style='font-size: 14pt; color: white'> x = %0.2f, <span style='color: white'> y = %0.2f</span>" % (mousePoint.x(), mousePoint.y()))


  #####################################################
  def buttonRandomClicked(self):
    print ("Show/Hide OldB")
    self.signal = np.random.rand(20)
    self.curve.setData(self.signal)

#####################################################
  def update(self):
    proxy = pg.SignalProxy(self.curve.scene().sigMouseMoved, rateLimit=60, slot=mouseMoved)
    self.statusBar().showMessage('Update timer event')

# MAIN ##################################################
def main():
  app = QtGui.QApplication(sys.argv)
  ex = TestClass()
  timer = QtCore.QTimer()
  timer.timeout.connect(ex.update)
  timer.start(200)
  sys.exit(app.exec_())


if __name__ == '__main__':
  main()

有什么我做错的地方吗?
谢谢。
2个回答

4
不需要使用`QTimer`执行该任务并创建名为`update()`的方法,因为`QMainWindow`有类似的方法,可能会干扰正确操作。
每次移动鼠标时都会触发`sigMouseMoved`信号,因此通常不需要使用`SignalProxy`。
`sigMouseMoved`信号返回相对于`PlotWidget`的像素坐标,而不是绘图的坐标,因此必须使用`ViewBox`的`mapSceneToView`方法进行转换--> `PlotItem` --> `PlotWidget`。
最后,不需要使用`GraphicsWindow()`,这会创建另一个窗口,只需使用一个`QWidget`即可。
import sys
from pyqtgraph.Qt import QtGui, QtCore
import numpy as np
import pyqtgraph as pg
import random

class TestClass(QtGui.QMainWindow):
    #####################################################
    def __init__(self):
        super(TestClass, self).__init__()
        self.initUI()
    ####################################################
    # GUI construction
    def initUI(self):
        self.setWindowTitle("Mouse Point, x & y")
        win = QtGui.QWidget()
        # creates plot
        self.plot = pg.PlotWidget()
        self.plot.setLabel('left', "B", units='T')
        self.plot.setLabel('bottom', "t", units='s')
        self.plot.showGrid(x=1, y=1, alpha=None)
        self.setCentralWidget(win)
        self.setGeometry(600, 600, 600, 600)
        self.setWindowTitle('Mouse Point, x& y GUI')

        # Create some widgets to be placed inside
        btnRandon = QtGui.QPushButton('Random Function')
        # Create a grid layout to manage the widgets size and position
        layout = QtGui.QGridLayout(win)

        # Add widgets to the layout in their proper positions
        layout.addWidget(btnRandon, 0, 0) # button to show or hide the OldB
        layout.addWidget(self.plot, 1, 0)

        mypen = pg.mkPen('y', width=1)
        self.curve = self.plot.plot(x=[], y=[], pen=mypen)

        # Plot
        self.t_plot_max = 30
        self.fe = 10e3
        self.t = np.arange(-1 * self.t_plot_max, 0, 1.0 / self.fe)
        self.len_signal = len(self.t)
        self.signal = np.zeros(self.len_signal, dtype=np.double)

        btnRandon.clicked.connect(self.buttonRandomClicked)
        self.curve.scene().sigMouseMoved.connect(self.onMouseMoved)

    def onMouseMoved(self, point):
        p = self.plot.plotItem.vb.mapSceneToView(point)
        self.statusBar().showMessage("{}-{}".format(p.x(), p.y()))

    def buttonRandomClicked(self):
        print ("Show/Hide OldB")
        self.signal = np.random.rand(20)
        self.curve.setData(self.signal)


# MAIN ##################################################
def main():
    app = QtGui.QApplication(sys.argv)
    ex = TestClass()
    ex.show()
    sys.exit(app.exec_())


if __name__ == '__main__':
    main()

嗨,我正在为这个应用程序使用QTimer。它是其他组件的一部分,我只是在这里添加了它。非常感谢您的编辑。我已经成功地让它运行了起来。干杯。 - Marco Roda

1
抱歉,我正在使用PyQt5。请尝试:
import sys

#from pyqtgraph.Qt import QtGui, QtCore     # ---
from PyQt5 import QtWidgets, QtGui, QtCore  # +++

import numpy as np
import pyqtgraph as pg
import time
import random

class TestClass(QtGui.QMainWindow):
  #####################################################
  def __init__(self):
    super(TestClass, self).__init__()
    self.num = 0                        ### +++
    self.initUI()

  #####################################################
  # GUI construction
  def initUI(self):
    win = pg.GraphicsWindow(title="Mouse Point, x & y")

    # creates plot
    self.plot = pg.PlotWidget()
    self.plot.setLabel('left', "B", units='T')
    self.plot.setLabel('bottom', "t", units='s')
    self.plot.showGrid(x=1, y=1, alpha=None)
    self.setCentralWidget(win)
    self.setGeometry(600, 600, 600, 600)
    self.setWindowTitle('Mouse Point, x& y GUI')

    # Create some widgets to be placed inside
    btnRandon = QtGui.QPushButton('Random Function')


    # Create a grid layout to manage the widgets size and position
    layout = QtGui.QGridLayout()
    win.setLayout(layout)

    # Add widgets to the layout in their proper positions
    layout.addWidget(btnRandon, 0, 0) # button to show or hide the OldB
    layout.addWidget(self.plot, 1, 0)

    mypen = pg.mkPen('y', width=1)
    self.curve = self.plot.plot(pen=mypen)

    # Plot
    self.t_plot_max = 30
    self.fe = 10e3
    self.t = np.arange(-1 * self.t_plot_max, 0, 1.0 / self.fe)
    self.len_signal = len(self.t)
    self.signal = np.zeros(self.len_signal, dtype=np.double)

    # status bar
    self.statusBar()

    # clicked button evt
    btnRandon.clicked.connect(self.buttonRandomClicked)

    # show graph
    self.show()

#  ### ------------------------------------------------
#  def mouseMoved(evt):
#    mousePoint = self.curve.vb.mapSceneToView(evt[0])
#    label.setText("<span style='font-size: 14pt; color: white'> x = %0.2f, <span style='color: white'> y = %0.2f</span>" % (mousePoint.x(), mousePoint.y()))


  #####################################################
  def buttonRandomClicked(self):
    print ("Show/Hide OldB")
    self.signal = np.random.rand(20)
    self.curve.setData(self.signal)

#####################################################
#  def update(self):
#    proxy = pg.SignalProxy(self.curve.scene().sigMouseMoved, rateLimit=60, slot=mouseMoved)
#    self.statusBar().showMessage('Update timer event')
### vvvvvvvvvvvvvvvvvvvvvvvvvvvvvvvvvvvvvvvvvvvvvvvvv
  def update(self):
    ### +++++++++++++++++++++++++++++++++++++++++++++
    def mouseMoved(evt): 
      print("-->> def mouseMoved(evt):", evt)
      print("\tevt.x()=`{}`, evt.y()=`{}`".format(evt.x(), evt.y()))

      # AttributeError: 'PlotDataItem' object has no attribute 'vb'        ### ???????
      #mousePoint = self.curve.vb.mapSceneToView(evt[0])

      # vvvv - > label what is it? <-- NameError: name `label` is not defined ### ???????
      #label.setText("<span style='font-size: 14pt; color: white'> x = %0.2f, <span style='color: white'> y = %0.2f</span>" % (mousePoint.x(), mousePoint.y()))


    self.source = self.curve.scene().sigMouseMoved
    #print(" source ", self.source)
    proxy = pg.SignalProxy(self.source, rateLimit=60, slot=mouseMoved) #+self
    #print("def update(self):222", proxy)
    if self.source is None:
        pass
        #sp.connect(sp, QtCore.SIGNAL('signal'), slot)
    else:
        #sp.connect(sp, signal, slot)
        proxy.signal.connect(mouseMoved)

    self.statusBar().showMessage('Update timer event `{}`'.format(self.num))
    self.num += 1    
    return proxy    


# MAIN ##################################################
def main():
  app = QtGui.QApplication(sys.argv)
  ex = TestClass()
  timer = QtCore.QTimer()
  timer.timeout.connect(ex.update)
  timer.start(200)
  sys.exit(app.exec_())


if __name__ == '__main__':
  main()

enter image description here


不,mouseMoved() 没有被调用。:/ 它对你起作用了吗? - Marco Roda
抱歉,我没有使用过pyqtgraph模块。但是我从mouseMoved(evt)模块中获取了值(x, y)。一些错误已经被注释掉了。我认为你会成功的。请查看更新后的代码。 - S. Nick

网页内容由stack overflow 提供, 点击上面的
可以查看英文原文,
原文链接