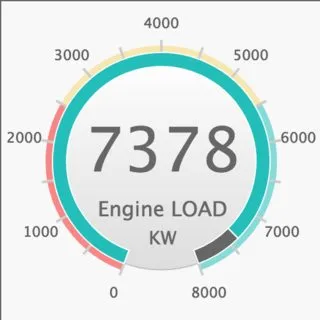
我用Highcharts构建了一个速度计图表,结合了仪表和饼图类型。在图表内,我有不同大小的文本,针对250x250像素大小进行了优化。
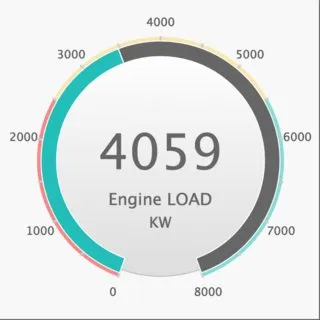
我想要实现的是,无论调整图表的大小如何,都能保持字体大小/图表容器比例相同。基本上无论容器的大小如何,都具有相同的外观。
我现在在包含图表的div上有一个基于像素的字体大小(通常是我的项目的基础字体大小),以及在图表本身上有1em(.highcharts-data-labels)。里面有我的自定义文本,标记了CSS类(.gauge-value,.gauge-text,.gauge-unit),我已经尝试给出合理的em值。
最佳方法是什么? JSFiddle with demo JS
我想要实现的是,无论调整图表的大小如何,都能保持字体大小/图表容器比例相同。基本上无论容器的大小如何,都具有相同的外观。
我现在在包含图表的div上有一个基于像素的字体大小(通常是我的项目的基础字体大小),以及在图表本身上有1em(.highcharts-data-labels)。里面有我的自定义文本,标记了CSS类(.gauge-value,.gauge-text,.gauge-unit),我已经尝试给出合理的em值。
最佳方法是什么? JSFiddle with demo JS
$(function() {
  var settings = {
    gaugeMinValue: 0,
    gaugeMaxValue: 8000,
    gaugeStartValue: 3000,
    gaugeStartAngle: -160,
    gaugeEndAngle: 160,
    gaugeUpdateInterval: 500 // ms
  };

  $('#gauge1').highcharts({
    tooltip: {
      enabled: false
    },
    chart: {
      type: 'gauge',
      backgroundColor: 'rgba(255, 255, 255, 0)',
      plotBackgroundColor: null,
      plotBackgroundImage: null,
      plotBorderWidth: 0,
      plotShadow: false,
      spacing: [5, 30, 5, 30],
      style: {
        fontSize: '1em'
      }
    },

    title: false,

    pane: {
      startAngle: settings.gaugeStartAngle,
      endAngle: settings.gaugeEndAngle
    },

    plotOptions: {
      gauge: {
        dial: {
          radius: 0
        },
        pivot: {
          radius: 0
        },
        dataLabels: {
          borderWidth: 0,
          padding: 0,
          verticalAlign: 'middle',
          style: false,
          formatter: function() {
            var output = '<div class="gauge-data">';
            output += '<span class="gauge-value">' + this.y + '</span>';
            output += '<span class="gauge-text">Engine LOAD</span>';
            output += '<span class="gauge-unit">KW</span>';
            output += '</div>';

            return output;
          },
          useHTML: true
        }
      },
      pie: {
        dataLabels: {
          enabled: true,
          distance: -10,
          style: false
        },
        startAngle: settings.gaugeStartAngle,
        endAngle: settings.gaugeEndAngle,
        center: ['50%', '50%'],
        states: {
          hover: {
            enabled: false
          }
        }
      }
    },

    // the value axis
    yAxis: {
      offset: 0,
      min: settings.gaugeMinValue,
      max: settings.gaugeMaxValue,

      title: false,

      minorTickWidth: 0,

      tickPixelInterval: 30,
      tickWidth: 2,
      tickPosition: 'outside',
      tickLength: 14,
      tickColor: '#ccc',
      lineColor: '#ccc',
      labels: {
        distance: 28,
        rotation: "0",
        step: 2,
      },

      plotBands: [{
        thickness: 10,
        outerRadius: "112%",
        from: 0,
        to: 2500,
        color: '#FB8585' // red
      }, {
        thickness: 10,
        outerRadius: "112%",
        from: 2500,
        to: 5500,
        color: '#F9E7AE' // yellow,
      }, {
        thickness: 10,
        outerRadius: "112%",
        from: 5500,
        to: 8000,
        color: '#83DAD9' // green
      }]
    },

    series: [{
      type: 'gauge',
      data: [settings.gaugeStartValue],
    }, {
      type: 'pie',
      innerSize: '87%',
      data: [{
        y: settings.gaugeStartValue,
        name: "",
        color: "#0bbeba"
      }, {
        y: settings.gaugeMaxValue - settings.gaugeStartValue,
        name: '',
        color: "#666666"
      }]
    }],

    navigation: {
      buttonOptions: {
        enabled: false
      }
    },

    credits: false
  });
});
CSS
.container {
  width: 50%;
  margin: 0 auto;
  font-size: 16px;
}

.gauge {
  width: 100%;
  max-width: 350px;
  max-height: 350px;
  min-width: 250px;
  min-height: 250px;
  padding: 0;
  border: 1px solid #666;
  background: #F8F8F8;
}

.gauge-data {
  text-align: center;
  color: #666;
  display: block;
}

.gauge-data > * {
  display: block;
}

.gauge-value {
  font-size: 3em;
}

.gauge-text {
  font-size: 1.0em;
  font-weigt: normal;
  margin-top: 10px;
}

.gauge-unit {
  margin-top: 5px;
  font-size: .9em;
}
图片 1:这是最佳视图