我想要筛选一个使用plotly创建的图表,基于我的数据中离散值的一列。最终目标是能够使用按钮更新筛选器的值,因此我不想事先筛选数据。
library(plotly)

df <- data.frame(group1 = rep(c('low', 'high'), each = 25),
                 x = rep(1:5, each = 5),
                 group2 = letters[1:5],
                 y = c(runif(25, 0, 2), runif(25, 3, 5)))

plot_ly(df, x = ~x, y = ~y, type = 'scatter',
        mode = 'line',
        color = ~group2,
        transforms = list(
            list(
                type = 'filter',
                target = ~group1,
                operation = '=',
                value = 'high'
            )
        )
)
我期望它会呈现以下图表:
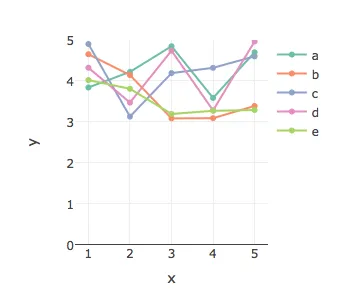 ,但是它给出了这个:
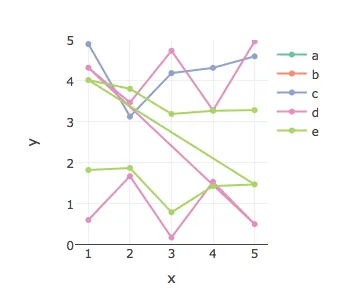 它似乎在错误的变量上进行了过滤。为什么数据没有按照我的预期进行过滤呢?请帮我看看。