检查在R中,sf几何对象是否连续

4

有没有办法在R中检查简单要素几何是否连续?我正在使用ggplot2创建一些地图,对于单多边形连续单位(即没有岛屿或偏远领土的国家),它可以正常工作。例如,拉脱维亚很好:
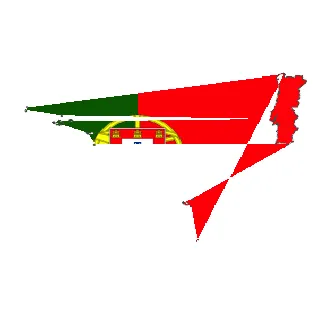
enter image description here

但葡萄牙会出现问题:

enter image description here

我猜这个问题出在筛选非连续部分的几何图形上,然后分别填充它们。是否有一个函数可以做到这一点?(这是荷兰的情况): enter image description here

葡萄牙的例子

(抱歉,需要单独下载图片,无法完全复现)

library(rnaturalearth)
library(rnaturalearthhires)
library(dplyr)
library(purrr)
library(tidyr)
library(scales)
library(magrittr)
library(png)
# > packageVersion("ggplot2")
# [1] ‘2.2.1.9000’
#devtools::install_github("tidyverse/ggplot2")
library(ggplot2)
library(sf) 
library(sp)


############ flag_fill function #############
flag_fill <- function(df){
  # establish boundaries; rescale to boundaries; filter into polygon
  # df must have columns 'geometry' and 'flag_image'
  df <- as_data_frame(df) %>% st_as_sf()

  # establish bounding boxes
  xmin <- map(df$geometry, st_bbox) %>% map_dbl("xmin")
  xmax <- map(df$geometry, st_bbox) %>% map_dbl("xmax")
  ymin <- map(df$geometry, st_bbox) %>% map_dbl("ymin")
  ymax <- map(df$geometry, st_bbox) %>% map_dbl("ymax")

  # check for alpha value
  alpha_check <- function(flag_image){
    if(dim(flag_image)[3] > 3) hasalpha <- TRUE else hasalpha <- FALSE
  }
  alph <- map_lgl(df$flag_image, alpha_check)

  # matrix of colours
  NumRow <- map_dbl(df$flag_image, function(x) dim(x)[1])
  NumCol <- map_dbl(df$flag_image, function(x) dim(x)[2])
  matrixList <- vector("list", nrow(df))
  matrixList <- mapply(matrix, matrixList, data = "#00000000", 
                       nrow = NumRow, ncol = NumCol, byrow = FALSE)

  matrixList <- map2(df$flag_image, alph, function(x, y) {
    rgb(x[,,1], x[,,2], x[,,3],
        ifelse(y, x[,,4], 1)
    ) %>% 
      matrix(ncol = dim(x)[2], nrow = dim(x)[1])
  })

  df_func <- function(DF){
    suppressWarnings(
      DF <- DF %>% 
        set_colnames(value = 1:ncol(.)) %>% 
        mutate(Y = nrow(.):1) %>% 
        gather(X, color, -Y) %>% 
        select(X, Y, color) %>%
        mutate(X = as.integer(X))
    )
    return(DF)
  }

  matrixList <- map(matrixList, as.data.frame)
  matrixList <- map(matrixList, df_func)
  # resize
  for(m in 1:length(matrixList)){
    matrixList[[m]]$X <- rescale(matrixList[[m]]$X, 
                                 to = c(xmin[[m]], xmax[[m]]))
    matrixList[[m]]$Y <- rescale(matrixList[[m]]$Y, 
                                 to = c(ymin[[m]], ymax[[m]]))
  }

  # filter into polygon
  latlonList <- map(df$geometry, st_coordinates)
  for(ll in 1:length(latlonList)){
    latlonList[[ll]] <- latlonList[[ll]][, 1:2]
  }
  poly_check <- function(x, y){
    x <- x[point.in.polygon(x$X, x$Y, 
                            y[, 1], 
                            y[, 2]
    ) %>% 
      as.logical, ]
    return(x)
  }
  matrixList <- Map(poly_check, matrixList, latlonList)

  # put back in dataframe:
  df <- df %>% 
    mutate(latlon = latlonList, plot_image = matrixList)

  return(df)
}

######## flag_plot function #############
flag_plot <- function(df){
  # takes a dataframe with column 'state' for country or state,
  # and plot_image, the result of flag_fill(), as well as 'color',
  # also the result of flag_fill()
  p <- ggplot() 
  df_list <- unique(df$state)
  for (i in seq_along(df_list)){
    DF <- df$plot_image[[i]]
    p <- p + geom_tile(data = DF,
                       aes(x = X, y = Y), 
                       fill = DF$color)
  }
  p + xlab(NULL) + ylab(NULL) +
    geom_sf(data = df, size = .2, alpha = 0.01) +
    theme(panel.background = element_blank(),
          panel.border = element_blank(),
          axis.text = element_blank(),
          panel.grid.major = element_line(colour = "white"), # hack from 
          #https://github.com/tidyverse/ggplot2/issues/2071
          axis.ticks = element_blank(),
          axis.line = element_blank())
}

######## data #########
globe <- countries10 %>% st_as_sf() %>% 
  filter(!is.na(ISO_A2)) %>% 
  select(state = SUBUNIT, iso = ISO_A2, continent = CONTINENT,
         region = SUBREGION, geometry) %>% 
  mutate(iso = tolower(iso))

####### images #########
# pngs can be downloaded from here: https://github.com/hjnilsson/country-flags
# using png image 250px as working directory 
country_list <- dir() %>% gsub("\\.png", '', .) %>% 
  .[which(!. %in% globe$iso)] %>% as_data_frame() %>% rename(iso = value)
globe <- left_join(globe, country_list) %>% 
  mutate(flag_image = list(array(NA, c(1, 1, 3))))
flags <- paste0(globe$iso, ".png")
for(i in 1:nrow(globe)){
  globe$flag_image[[i]] <- readPNG(source = flags[[i]])
}

######## plot: 
globe %>% filter(state %in% c("Portugal")) %>% 
  flag_fill() %>% 
  flag_plot()

2
这应该会让你走上正确的道路:https://dev59.com/BFcP5IYBdhLWcg3wRoII - MichaelChirico
1个回答

6
问题不在于sf,而是在于geom_tile()。当我们有岛屿时,会有许多多边形,但这段代码将它们视为单个多边形。
您可以通过将组列存储在latlonList中来解决这个问题。
for(ll in 1:length(latlonList)){
    latlonList[[ll]] <- latlonList[[ll]][, c(1, 2, 4)]
}

使用poly_check()函数计算组内多边形内部的点。

  poly_check <- function(x, y) {

    island_list <- y %>% 
      as_tibble() %>% 
      group_by(L2) %>% 
      nest() %>% 
      pull(data)

    lists <- map(island_list, ~{
      y <- as.matrix(.x)
      x[point.in.polygon(x$X, x$Y, y[, 1], y[, 2]) %>% as.logical, ]
    })
    bind_rows(lists, .id = ".id")
  }

我认为可以使用do()函数简化此功能。

最后,我们需要在geom_tile()函数内添加group = .id

  for (i in seq_along(df_list)){
    DF <- df$plot_image[[i]]
    p <- p + geom_tile(data = DF, aes(x = X, y = Y, group = .id), 
                       fill = DF$color)
  }

完整代码在这里。
library(rnaturalearth)
library(rnaturalearthhires)
library(dplyr)
library(purrr)
library(tidyr)
library(scales)
library(magrittr)
library(png)
# > packageVersion("ggplot2")
# [1] ‘2.2.1.9000’
#devtools::install_github("tidyverse/ggplot2")
library(ggplot2)
library(sf) 
library(sp)


############ flag_fill function #############
flag_fill <- function(df){

  # establish boundaries; rescale to boundaries; filter into polygon
  # df must have columns 'geometry' and 'flag_image'
  df <- as_data_frame(df) %>% st_as_sf()

  # establish bounding boxes
  xmin <- map(df$geometry, st_bbox) %>% map_dbl("xmin")
  xmax <- map(df$geometry, st_bbox) %>% map_dbl("xmax")
  ymin <- map(df$geometry, st_bbox) %>% map_dbl("ymin")
  ymax <- map(df$geometry, st_bbox) %>% map_dbl("ymax")

  # check for alpha value
  alpha_check <- function(flag_image){
    if(dim(flag_image)[3] > 3) hasalpha <- TRUE else hasalpha <- FALSE
  }
  alph <- map_lgl(df$flag_image, alpha_check)

  # matrix of colours
  NumRow <- map_dbl(df$flag_image, function(x) dim(x)[1])
  NumCol <- map_dbl(df$flag_image, function(x) dim(x)[2])
  matrixList <- vector("list", nrow(df))
  matrixList <- mapply(matrix, matrixList, data = "#00000000", 
                       nrow = NumRow, ncol = NumCol, byrow = FALSE)

  matrixList <- map2(df$flag_image, alph, function(x, y) {
    rgb(x[,,1], x[,,2], x[,,3], ifelse(y, x[,,4], 1)) %>% 
      matrix(ncol = dim(x)[2], nrow = dim(x)[1])
  })

  df_func <- function(DF){
    suppressWarnings(
      DF <- DF %>% 
        set_colnames(value = 1:ncol(.)) %>% 
        mutate(Y = nrow(.):1) %>% 
        gather(X, color, -Y) %>% 
        select(X, Y, color) %>%
        mutate(X = as.integer(X))
    )
    return(DF)
  }

  matrixList <- map(matrixList, as.data.frame)
  matrixList <- map(matrixList, df_func)
  # resize
  for(m in 1:length(matrixList)){
    matrixList[[m]]$X <- rescale(matrixList[[m]]$X, to = c(xmin[[m]], xmax[[m]]))
    matrixList[[m]]$Y <- rescale(matrixList[[m]]$Y, to = c(ymin[[m]], ymax[[m]]))
  }

  # filter into polygon
  latlonList <- map(df$geometry, st_coordinates)


  for(ll in 1:length(latlonList)){
    latlonList[[ll]] <- latlonList[[ll]][, c(1, 2, 4)]
  }
  poly_check <- function(x, y) {

    island_list <- y %>% 
      as_tibble() %>% 
      group_by(L2) %>% 
      nest() %>% 
      pull(data)

    lists <- map(island_list, ~{
      y <- as.matrix(.x)
      x[point.in.polygon(x$X, x$Y, y[, 1], y[, 2]) %>% as.logical, ]
    })
    bind_rows(lists, .id = ".id")
  }
  matrixList <- Map(poly_check, matrixList, latlonList)

  # put back in dataframe:
  df <- df %>% 
    mutate(latlon = latlonList, plot_image = matrixList)

  return(df)
}

######## flag_plot function #############
flag_plot <- function(df){
  # takes a dataframe with column 'state' for country or state,
  # and plot_image, the result of flag_fill(), as well as 'color',
  # also the result of flag_fill()

  p <- ggplot() 
  df_list <- unique(df$state)

  for (i in seq_along(df_list)){
    DF <- df$plot_image[[i]]
    p <- p + geom_tile(data = DF, aes(x = X, y = Y, group = .id), 
                       fill = DF$color)
  }

  p + xlab(NULL) + ylab(NULL) +
    geom_sf(data = df, size = .2, alpha = 0.01) +
    theme(panel.background = element_blank(),
          panel.border = element_blank(),
          axis.text = element_blank(),
          panel.grid.major = element_line(colour = "white"), # hack from 
          #https://github.com/tidyverse/ggplot2/issues/2071
          axis.ticks = element_blank(),
          axis.line = element_blank())
}

######## data #########
globe <- countries10 %>% 
  st_as_sf() %>% 
  filter(!is.na(ISO_A2)) %>% 
  select(state = SUBUNIT, iso = ISO_A2, continent = CONTINENT,
         region = SUBREGION, geometry) %>% 
  mutate(iso = tolower(iso))

####### images #########
# pngs can be downloaded from here: https://github.com/hjnilsson/country-flags
# using png image 250px as working directory 
country_list <- dir() %>% 
  gsub("\\.png", '', .) %>% 
  .[which(!. %in% globe$iso)] %>% 
  as_data_frame() %>% 
  rename(iso = value)
globe <- left_join(globe, country_list) %>% 
  mutate(flag_image = list(array(NA, c(1, 1, 3))))
flags <- paste0(globe$iso, ".png")
for(i in 1:nrow(globe)) {
  globe$flag_image[[i]] <- readPNG(source = flags[[i]])
}

######## plot: 
globe %>% filter(state %in% c("Portugal")) %>% 
  flag_fill() %>% 
  flag_plot()

网页内容由stack overflow 提供, 点击上面的
可以查看英文原文,
原文链接