我想要做的只是让宽度变大,高度变小。我只是在做光栅图,但这个问题适用于任何MATLAB figure。当创建figure时,我可以直接手动调整其大小,但我希望程序能够以正确的大小输出。
设置图形大小
92
- ale
5个回答
82
可以设置的figure属性在此处引用。
然后您可以使用:
figure_number = 1;
x      = 0;   % Screen position
y      = 0;   % Screen position
width  = 600; % Width of figure
height = 400; % Height of figure (by default in pixels)

figure(figure_number, 'Position', [x y width height]);
- Marcus Frödin
2
66
写成一行代码:
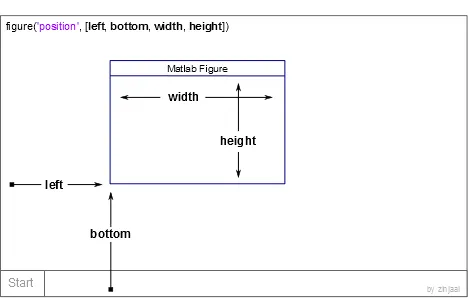
figure('position', [0, 0, 200, 500]) % create new figure with specified size
- zinjaai
31
 figure (1)
 hFig = figure(1);
 set(gcf,'PaperPositionMode','auto')
 set(hFig, 'Position', [0 0 xwidth ywidth])
 plot(x,y)
 print -depsc2 correlation.eps;       % for saving in eps, look up options for saving as png or other formats you may need
这将按照指定的尺寸保存该图
- user1934314
1
8如果要“打印”(导出)图形,+1 对于“PaperPositionMode”是必需的。 - Ali
1
我使用以下步骤成功地得到了一个好的结果(在开始时运行两次Matlab):
h = gcf; % Current figure handle
set(h,'Resize','off');
set(h,'PaperPositionMode','manual');
set(h,'PaperPosition',[0 0 9 6]);
set(h,'PaperUnits','centimeters');
set(h,'PaperSize',[9 6]); % IEEE columnwidth = 9cm
set(h,'Position',[0 0 9 6]);
% xpos, ypos must be set
txlabel = text(xpos,ypos,'$$[\mathrm{min}]$$','Interpreter','latex','FontSize',9);

% Dump colored encapsulated PostScript
print('-depsc2','-loose', 'signals');
- Thomas
0
一种不同的方法。
在h = figure()之后指定属性或修改图形句柄属性,以创建一个全屏幕基于标准化单位的图形。
figure('units','normalized','outerposition',[0 0 1 1])
units属性可以调整为英寸、厘米、像素等。
请参阅figuredocumentation。
- SecretAgentMan
网页内容由stack overflow 提供, 点击上面的可以查看英文原文,
原文链接
原文链接
set定义的相同尺寸保存图形?因为saveas(gcf, file, 'png')默认使用不同尺寸。 - István Zachar