我想在我的图表上使用18pt大小的大标题,然后在其下方使用较小的10pt字体的子标题。如何在matplotlib中实现这一点?似乎
title()函数只能使用一个字符串和单个fontsize属性。肯定有方法可以完成此操作,但是怎么做呢?title()函数只能使用一个字符串和单个fontsize属性。肯定有方法可以完成此操作,但是怎么做呢?我的做法是使用title()函数设置副标题,使用suptitle()设置主标题(它们可以使用不同的字体大小参数)。
title)和“总标题”(suptitle)居中方式不同,因此它们在绘图时可能无法对齐。 - Alex虽然这种方法不太灵活,无法设置多个字体大小,但是在pyplot.title() 字符串中添加换行符可以是一个简单的解决方案;
plt.title('Really Important Plot\nThis is why it is important')
这是一个使用Pandas编写的代码示例,实现了Floris van Vugt的回答(2010年12月20日)。他说:
>我用title()函数来设置子标题,用suptitle()函数来设置主标题(它们可以接受不同的字体大小参数)。希望对你有所帮助!
import pandas as pd
import matplotlib.pyplot as plt

d = {'series a' : pd.Series([1., 2., 3.], index=['a', 'b', 'c']),
      'series b' : pd.Series([1., 2., 3., 4.], index=['a', 'b', 'c', 'd'])}
df = pd.DataFrame(d)

title_string = "This is the title"
subtitle_string = "This is the subtitle"

plt.figure()
df.plot(kind='bar')
plt.suptitle(title_string, y=1.05, fontsize=18)
plt.title(subtitle_string, fontsize=10)
subtitle_string=('Upper panel: Max, Avg, Min, Footprint % | Lower panel: Footprint % and Critical Cells %'),然后再调用plt.suptitle(title_string, y=0.99, fontsize=17),那么副标题会被打印在第二个子图上而不是第一个,我也看不到图例的打印。 - FaCoffee我认为没有内置的方法,但是您可以通过在轴上方留出更多空间并使用figtext来实现:
axes([.1,.1,.8,.7])
figtext(.5,.9,'Foo Bar', fontsize=18, ha='center')
figtext(.5,.85,'Lorem ipsum dolor sit amet, consectetur adipiscing elit',fontsize=10,ha='center')
ha 是 horizontalalignment 的缩写。
我采用的解决方案是:
suptitle()来设置实际标题title()设置副标题并使用可选参数y进行调整: import matplotlib.pyplot as plt
"""
some code here
"""
plt.title('My subtitle',fontsize=16)
plt.suptitle('My title',fontsize=24, y=1)
plt.show()
两段文本之间可能会有一些不好的重叠。你可以通过调整y的值来解决这个问题。
y 参数显示副标题,而不是解释文本中的标题... - sdbbs只需使用TeX!这样可以正常工作:
title(r"""\Huge{Big title !} \newline \tiny{Small subtitle !}""")
编辑:要启用TeX处理,需要将"usetex = True"行添加到matplotlib参数中:
fig_size = [12.,7.5]
params = {'axes.labelsize': 8,
      'text.fontsize':   6,
      'legend.fontsize': 7,
      'xtick.labelsize': 6,
      'ytick.labelsize': 6,
      'text.usetex': True,       # <-- There
      'figure.figsize': fig_size,
      }
rcParams.update(params)
我猜您的电脑上也需要一个可用的TeX发行版。所有细节都在这个页面上给出:
如此处所述,您可以使用matplotlib.pyplot.text对象以实现相同的结果:
plt.text(x=0.5, y=0.94, s="My title 1", fontsize=18, ha="center", transform=fig.transFigure)
plt.text(x=0.5, y=0.88, s= "My title 2 in different size", fontsize=12, ha="center", transform=fig.transFigure)
plt.subplots_adjust(top=0.8, wspace=0.3)
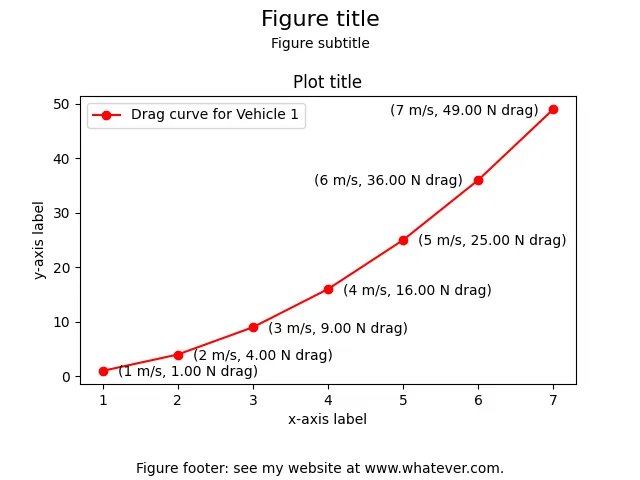
这是我在摸索如何使用matplotlib满足我的需求时编写的一个Hello World。对于所有标题和标签的需求,它非常详尽。
下面是如何创建副标题的方法:只需要在合适的位置使用普通的图文框即可:
# Figure subtitle
fig.text(0.5, 0.9, "Figure subtitle", horizontalalignment="center")
# Figure title (super-title)
fig.suptitle("Figure title", fontsize=16)
# Figure subtitle
fig.text(0.5, 0.9, "Figure subtitle", horizontalalignment="center")
# Figure footer title
fig.text(0.5, 0.015, "Figure footer: see my website at www.whatever.com.",
         horizontalalignment="center")

# Plot title, axes, and legend
plt.title("Plot title")
plt.xlabel("x-axis label")
plt.ylabel("y-axis label")
plt.plot(x_vals, y_vals, 'r-o', label="Drag curve for Vehicle 1")
plt.legend()

# Plot point labels
plt.text(x+.2, y-1, f"({x} m/s, {y:.2f} N drag)",
         horizontalalignment="left", rotation=0)
plot_hello_world_set_all_titles_axis_labels_etc.py 来自我的 eRCaGuy_hello_world 代码仓库:
import matplotlib.pyplot as plt

# ----------------------------------
# 1. Create a new figure
# - Can be done multiple times to create multiple GUI windows of figures.
# ----------------------------------

# Create a new figure. Now, all calls to `plt.whatever()` will apply to this
# figure.
# - When done adding subplots below, you can create more figures using this call
#   if you want to create multiple separate GUI windows of figures.
fig = plt.figure()

# ----------------------------------
# 2. Add a plot or subplot to it.
# - You can use the `fig.add_subplot()` call below multiple times to add
#   multiple subplots to your figure.
# ----------------------------------
# Optional: make this plot a subplot in a grid of plots in your figure
# fig.add_subplot(2, 2, 1) # `1` row x `1` column of plots, this is subplot `1`

# List of x values
x_vals = [1, 2, 3, 4, 5, 6, 7]
# Use a "list comprehension" to make some y values
y_vals = [val**2 for val in x_vals]

# Plot your x, y values: red (`r`) line (`-`) with circles (`o`) for points
plt.plot(x_vals, y_vals, 'r-o', label="Drag curve for Vehicle 1")
plt.legend()
plt.xlabel("x-axis label")
plt.ylabel("y-axis label")
plt.title("Plot title")

# display (x, y) values next to each point in your plot or subplot
for i, x in enumerate(x_vals):
    y = y_vals[i]
    # for your last 2 points only
    if i >= len(x_vals) - 2:
        plt.text(x-.2, y-1, f"({x} m/s, {y:.2f} N drag)",
                 horizontalalignment="right", rotation=0)
    # for all other points
    else:
        plt.text(x+.2, y-1, f"({x} m/s, {y:.2f} N drag)",
                 horizontalalignment="left", rotation=0)

# ----------------------------------
# 3. When all done adding as many subplots as you want to for your figure,
#    configure your figure title, subtitle, and footer.
# ----------------------------------

fig.suptitle("Figure title", fontsize=16)
# Figure subtitle
fig.text(0.5, 0.9, "Figure subtitle", horizontalalignment="center")
# Figure footer title
fig.text(0.5, 0.015, "Figure footer: see my website at www.whatever.com.",
         horizontalalignment="center")
# Important!:
# 1. Use `top=0.8` to bring the top of the plot down to leave some space above
# the plot for the figure subtitle to go above the plot title!
# 2. Use `bottom=0.2` to bring the bottom of the plot up to leave space for the
# figure footer.
plt.subplots_adjust(top=0.8, bottom=0.2)

# ----------------------------------
# 4. Finally, when done adding all of the figures you want to, each with as many
#    subplots as you want, call this to show all figures!
# ----------------------------------

plt.show()
plt.text()为每个点绘制(x, y)文本,并处理第一个和最后一个点的自定义文本格式fig, ax = plt.subplots(2,1, figsize=(5,5))
ax[0, 0].plot(x,y)
ax[0, 0].set_title('text')