这里有两种方法:第一种使用表格结构来确定行数和列数,而第二种使用单元格数量。
方法 #1: 表格结构
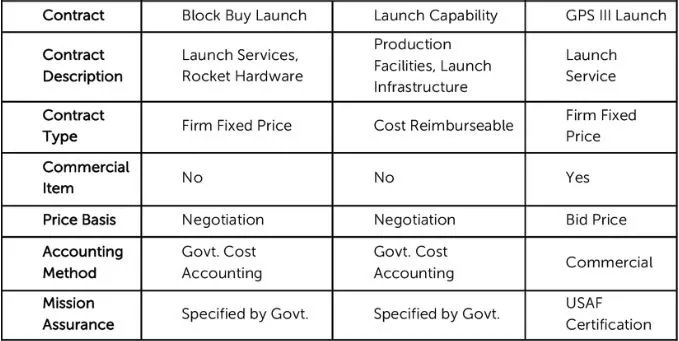
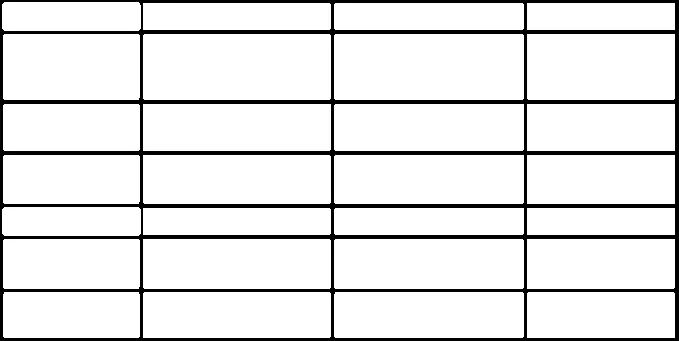
这个想法是我们可以计算表格的水平线和垂直线的数量来确定行数和列数。对于行,它是 rows = 水平线数 - 1 ,对于列,它是 columns = 垂直线数 - 1。
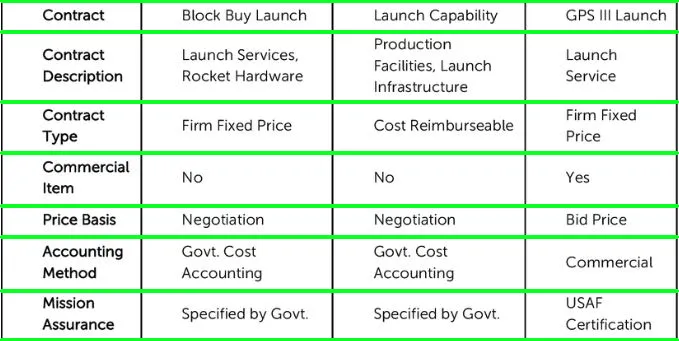
检测到绿色的水平线
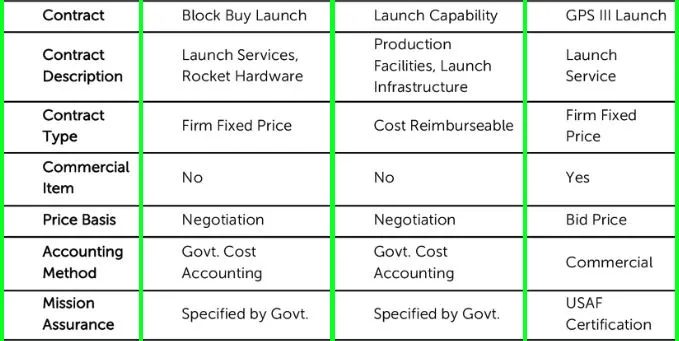
检测到绿色垂直线。
结果
Rows: 7
Columns: 4
代码
import cv2
image = cv2.imread('1.jpg')
gray = cv2.cvtColor(image, cv2.COLOR_BGR2GRAY)
thresh = cv2.threshold(gray, 0, 255, cv2.THRESH_BINARY_INV + cv2.THRESH_OTSU)[1]
horizontal_kernel = cv2.getStructuringElement(cv2.MORPH_RECT, (25,1))
horizontal = cv2.morphologyEx(thresh, cv2.MORPH_OPEN, horizontal_kernel, iterations=2)
cnts = cv2.findContours(horizontal, cv2.RETR_EXTERNAL, cv2.CHAIN_APPROX_SIMPLE)
cnts = cnts[0] if len(cnts) == 2 else cnts[1]
rows = 0
for c in cnts:
cv2.drawContours(image, [c], -1, (36,255,12), 2)
rows += 1
vertical_kernel = cv2.getStructuringElement(cv2.MORPH_RECT, (1,25))
vertical = cv2.morphologyEx(thresh, cv2.MORPH_OPEN, vertical_kernel, iterations=2)
cnts = cv2.findContours(vertical, cv2.RETR_EXTERNAL, cv2.CHAIN_APPROX_SIMPLE)
cnts = cnts[0] if len(cnts) == 2 else cnts[1]
columns = 0
for c in cnts:
cv2.drawContours(image, [c], -1, (36,255,12), 2)
columns += 1
print('Rows:', rows - 1)
print('Columns:', columns - 1)
cv2.imshow('thresh', thresh)
cv2.imshow('image', image)
cv2.waitKey()
方法二:细胞计数
获取二进制图像。 加载图像,转换为灰度图像,高斯模糊,然后使用大津阈值法进行阈值分割。
删除单元格内的文本。 查找轮廓并使用cv2.contourArea()过滤轮廓,通过使用cv2.drawContours()填充轮廓来删除文本。
反转图像。 我们反转图像,使单元格为白色,背景为黑色。
排序单元格并对行/列求和。 我们查找轮廓,然后使用imutils.contours.sort_contours将轮廓从上到下排序。接下来,我们遍历轮廓并找到质心以获取(cX, cY)坐标。这样做的想法是通过比较每个单元格的值来确定它是否是一个新行或同一行中的单元格,使用偏移量。如果值大于某个偏移值,则表示该单元格位于新行中。我们构建一个模型表,其中表的长度给出行数,任何索引的长度都给出列数。
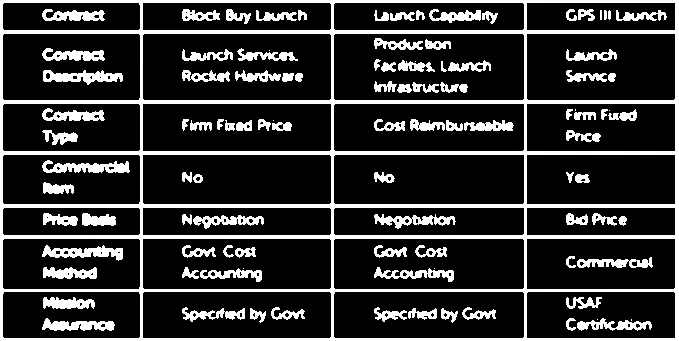
二进制图像
已移除文本轮廓 + 图像反转
这里是迭代每个单元格以计算行数和列数的可视化呈现。
结果
Rows: 7
Columns: 4
代码
import numpy as np
from imutils import contours
import cv2
image = cv2.imread('1.jpg')
gray = cv2.cvtColor(image, cv2.COLOR_BGR2GRAY)
blur = cv2.GaussianBlur(gray, (5,5), 0)
thresh = cv2.threshold(blur, 0, 255, cv2.THRESH_BINARY_INV + cv2.THRESH_OTSU)[1]
cnts = cv2.findContours(thresh, cv2.RETR_TREE, cv2.CHAIN_APPROX_SIMPLE)
cnts = cnts[0] if len(cnts) == 2 else cnts[1]
for c in cnts:
area = cv2.contourArea(c)
if area < 4000:
cv2.drawContours(thresh, [c], -1, 0, -1)
invert = 255 - thresh
offset, old_cY, first = 10, 0, True
visualize = cv2.cvtColor(invert, cv2.COLOR_GRAY2BGR)
cnts = cv2.findContours(invert, cv2.RETR_TREE, cv2.CHAIN_APPROX_SIMPLE)
cnts = cnts[0] if len(cnts) == 2 else cnts[1]
(cnts, _) = contours.sort_contours(cnts, method="top-to-bottom")
for c in cnts:
M = cv2.moments(c)
cX = int(M["m10"] / M["m00"])
cY = int(M["m01"] / M["m00"])
if (abs(cY) - abs(old_cY)) > offset:
if first:
row, table = [], []
first = False
old_cY = cY
table.append(row)
row = []
if ((abs(cY) - abs(old_cY)) <= offset) or first:
row.append(1)
'''
cv2.circle(visualize, (cX, cY), 10, (36, 255, 12), -1)
cv2.imshow('visualize', visualize)
cv2.waitKey(200)
'''
print('Rows: {}'.format(len(table)))
print('Columns: {}'.format(len(table[1])))
cv2.imshow('invert', invert)
cv2.imshow('thresh', thresh)
cv2.waitKey()