在模型选择后,我的最佳模型包含两个连续变量和一个交互项。
我的数据如下:
df<-structure(list(Height_RR = c(1.09861228866811, -0.143100843640673,
                             -0.990398704027877, -0.990398704027877, 0.0800427076735365, 0.916290731874155,
                             1.04982212449868, 0.430782916092454, 0.575364144903562, 0.0953101798043248,
                             -0.405465108108164, 0.132489183046079, 0.117783035656383, 1.04982212449868,
                             -0.916290731874155, 1.20397280432594, -0.356674943938732, 0.287682072451781,
                             -0.356674943938732, 0.287682072451781, -0.356674943938732, 0.287682072451781,
                             -0.318387168583869, -0.318387168583869, -0.318387168583869, -0.356674943938732,
                             -0.393042588109607, -0.485507815781701, -0.405465108108164, -0.441832752279039,
                             0.42744401482694, 0.510825623765991, 1.04982212449868, 0.847297860387204,
                             -0.356674943938732),
               CWD = c(-173.850331373113, -1063.65743501896,
               -1152.77456298827, -1200.14062275391, -1191.1454796875, -154.366681649412,
              -160.237513231871, -148.917478721144, -655.155005728001, -1081.17124999999,
              -192.437500000001, -664.538976252586, -540.755930464004, -230.945841787738,
               -632.705104201392, -159.376784299775, -686.792144988283, -686.792144988283,
               -686.792144988283, -686.792144988283, -686.792144988283, -686.792144988283,
               -681.113600988285, -681.113600988285, -681.113600988285, -203.026923561875,
               -32.6625046554887, -499.426709860029, -190.121159505859, -871.942483370128,
              -988.569593505865, -248.140000031999, -165.422048285183, -165.422048285183,
                -165.422048285183),
              yi = c(0.201673327454905, 0.374187870755073,
              -1.26459742614237, -3.4162352590267, -1.20397280432594, 0.943371690476826,
              1.26291533995939, 0.551099522903931, 0.506212624114382, 1.62113395219729,
              -0.272257602126149, 0.345151698858396, 0.104290175606367, 4.56284362374715,
              0.532233017860013, 0.697137826765664, -1.01160091167848, -1.07044141170141,
              0.646627164925052, -0.519875459285909, -0.646627164925052, -0.519875459285909,
              -0.424883193965266, 0.074107972153722, 0.074107972153722, 0.693147180559945,
              0.0707340508073709, 0.358554516423803, -0.682820066404096, -0.638455438611528,
              0.410070448690588, 1.11317243999944, 1.26976054486394, 1.45111186119636,
              1.44238382777093)), .Names = c("Height_RR", "CWD", "yi"), row.names = c(1L,
              2L, 3L, 4L, 5L, 6L, 7L, 8L, 10L, 11L, 12L, 13L, 14L, 15L, 16L,
              17L, 19L, 20L, 21L, 22L, 23L, 24L, 25L, 26L, 27L, 28L, 29L, 30L,
              31L, 33L, 34L, 35L, 36L, 37L, 38L), class = "data.frame")
我的模型参数估计结果如下:
                 estimate  se     zval    pval    ci.lb     ci.ub
intrcpt          1.1422  0.3862   2.9575  0.0031   0.3852   1.8991  **
Height_RR        0.3412  0.1488   2.2925  0.0219   0.0495   0.6328   *
CWD              0.0014  0.0006   2.2698  0.0232   0.0002   0.0026   *
Height_RR:CWD   -0.0006  0.0002  -3.0161  0.0026  -0.0009  -0.0002  **
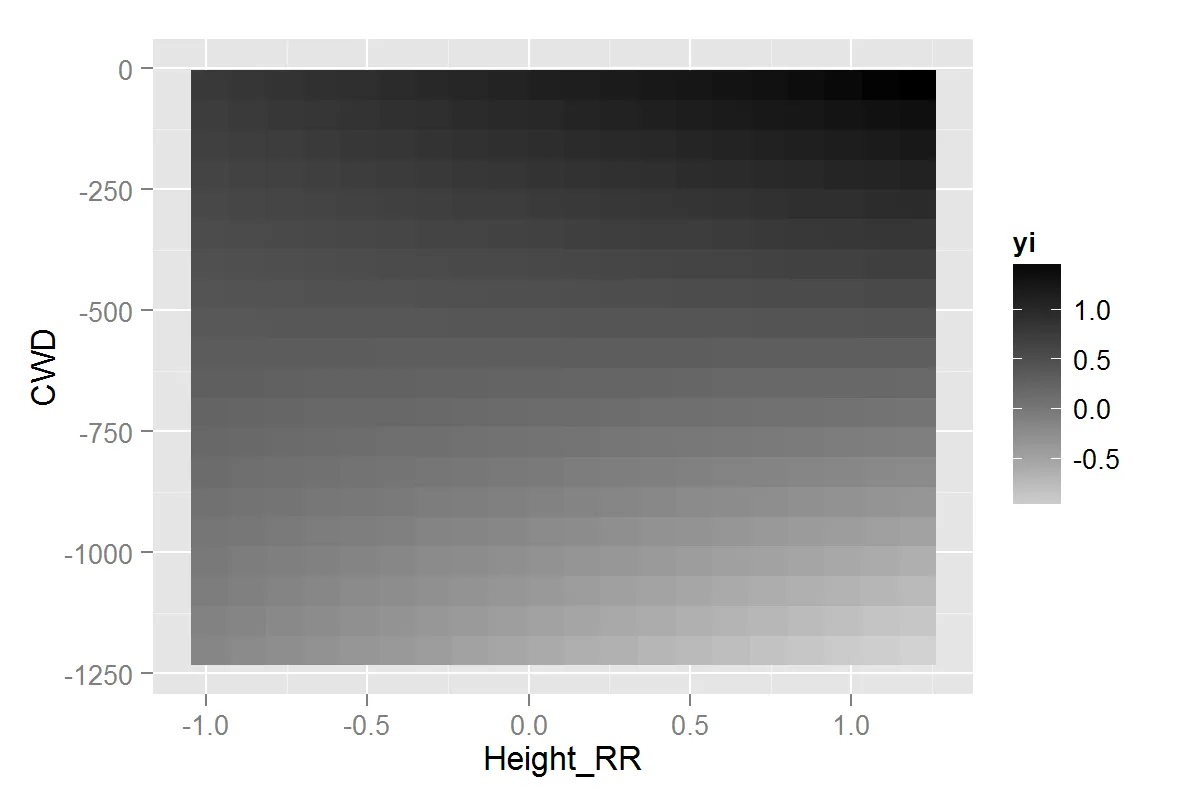
我想使用一个图形来展示这个结果的预测值,其中x轴和y轴都是连续的预测变量,预测值由颜色渐变表示。使用这段代码,我得到了以下图形。
library(ggplot2)
new.data<-expand.grid(Height_RR=seq(min(df$Height_RR),max(df$Height_RR),length.out = 20),
                  CWD=seq(min(df$CWD,na.rm = T),max(df$CWD,na.rm = T),length.out = 20))

new.data$yi<-(new.data$Height_RR*0.3412)+1.1422+(0.0014*new.data$CWD)+((new.data$CWD*new.data$Height_RR)*0.0006)


ggplot(new.data,aes(x=Height_RR,y=CWD,fill=yi))+geom_raster()+scale_fill_continuous(low="light grey",high="black")
然而,我没有所有区域的数据,因此我正在对该模型进行外推。下图中的最小凸包和点显示了我的数据所在的位置。
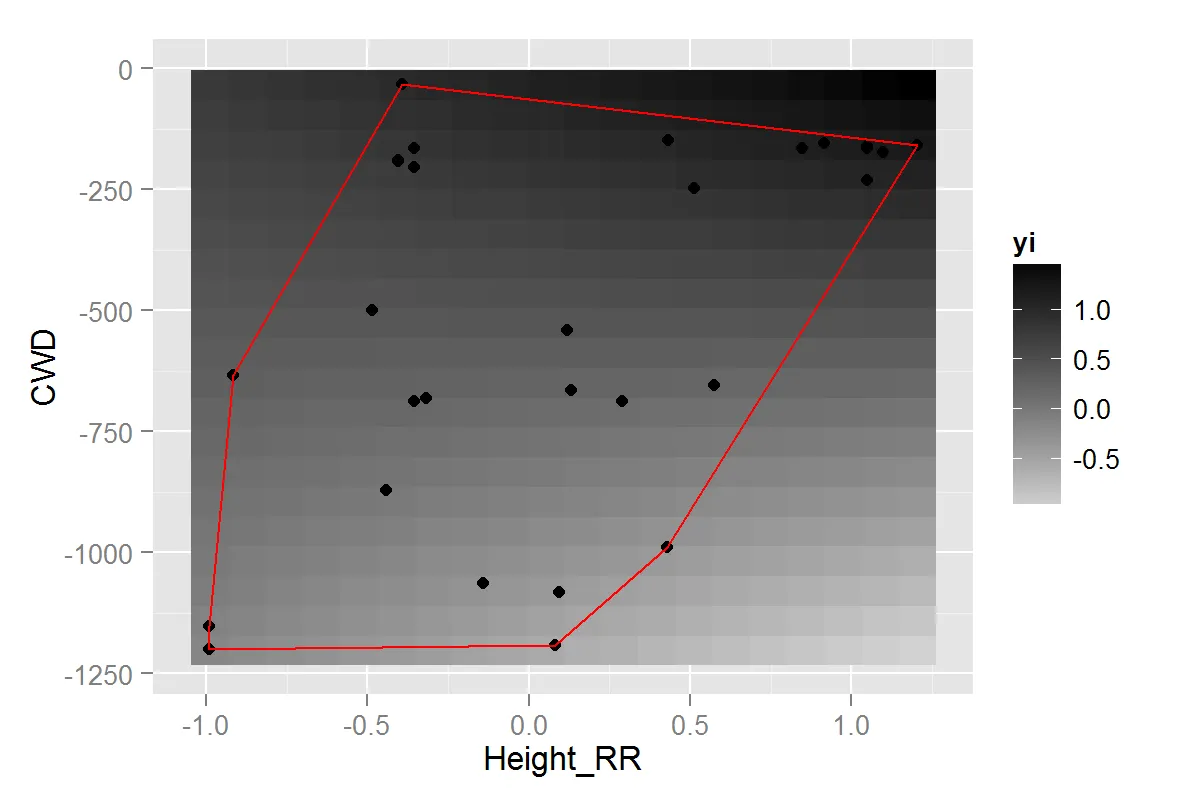
我的问题是:
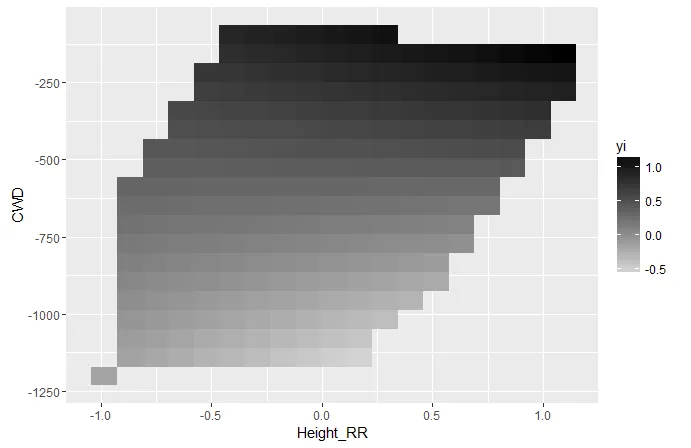
- 是否有一种方法可以创建数据框来限制我的预测范围(即在多边形内)?
- 如果没有,是否有更好的方法来显示两个连续变量之间的交互作用?