我尝试:
points = [...]
axe.plot([i[0] for i in points], [i[1] for i in points], linestyle='-', linewidth=10,
color='black', markeredgewidth=2, markeredgecolor='green')
我尝试:
points = [...]
axe.plot([i[0] for i in points], [i[1] for i in points], linestyle='-', linewidth=10,
color='black', markeredgewidth=2, markeredgecolor='green')
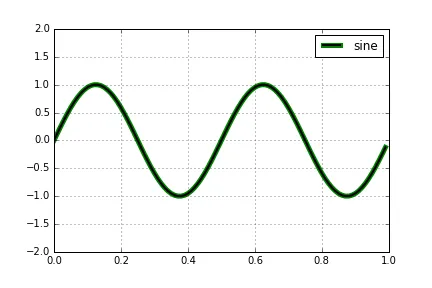
如果您绘制一条线两次,它不会出现在图例中。使用patheffects确实更好。以下是两个简单的示例:
import matplotlib.pyplot as plt
import numpy as np
import matplotlib.patheffects as pe

# setup data
x = np.arange(0.0, 1.0, 0.01)
y = np.sin(2*2*np.pi*t)

# create line plot including an outline (stroke) using path_effects
plt.plot(x, y, color='k', lw=2, path_effects=[pe.Stroke(linewidth=5, foreground='g'), pe.Normal()])
# custom plot settings
plt.grid(True)
plt.ylim((-2, 2))
plt.legend(['sine'])
plt.show()
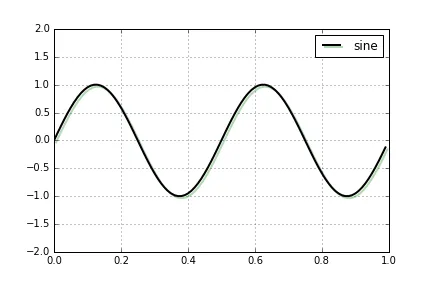
或者如果你想添加一条阴影线
# create line plot including an simple line shadow using path_effects
plt.plot(x, y, color='k', lw=2, path_effects=[pe.SimpleLineShadow(shadow_color='g'), pe.Normal()])
# custom plot settings
plt.grid(True)
plt.ylim((-2, 2))
plt.legend(['sine'])
plt.show()
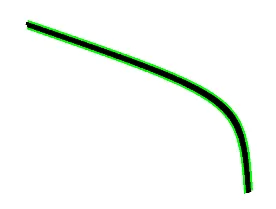
只需使用不同的线条粗细绘制两次即可:
axe.plot([i[0] for i in points], [i[1] for i in points], linestyle='-', linewidth=10,
color='green')
axe.plot([i[0] for i in points], [i[1] for i in points], linestyle='-', linewidth=5,
color='black')