我想创建一个点网格,对应于384孔板实验中的发光值。我将该板绘制为.png文件,并覆盖网格,以便每个点都应位于板的一个孔中。提供示例代码和数据。
使用 ggplot2 可以实现吗?
我正在使用以下代码(提供示例数据):
library(ggplot2)
library(png)
library(RCurl)
library(grid)

example.gg <- read.csv("https://docs.google.com/spreadsheets/d/e/2PACX-1vRcX5aMZGCp9Bs3BRZSg8k4o-kbSjOO5z3LsRxgIv4qJHz1fG-Argruje32OuZ2Tt2qPaNGksGr4Jia/pub?output=csv",
            row.names = 1)
example.gg$Row <- factor(example.gg$Row, levels = rev(sort(unique(example.gg$Row))))

png.img <- readPNG(getURLContent("https://i.imgur.com/QeSO7d3.png"))
img.rg <- rasterGrob(png.img, interpolate=TRUE)

gp <- ggplot(example.gg,
             aes(x = Col, y = Row, col = Lum)) +
  annotation_custom(img.rg, xmin=-Inf, xmax=Inf, ymin=-Inf, ymax=Inf) +
  geom_point(shape = 15) +
  theme_void()
gp
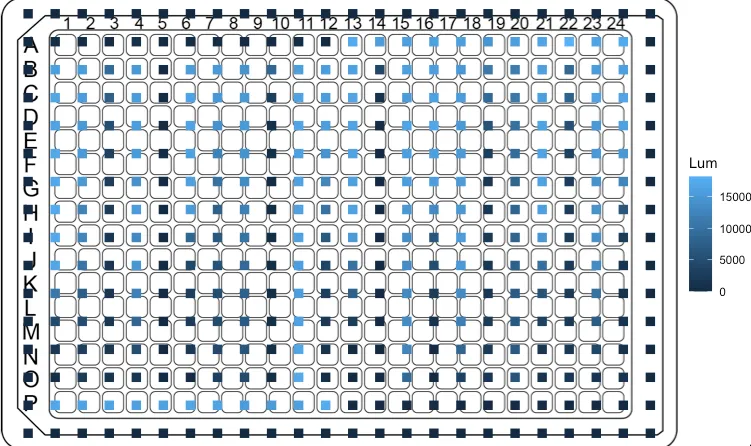
这是生成的图片:
答案
感谢Dan Adams提供的原始答案。
gp <- ggplot(example.gg,
             aes(x = Col, y = Row, col = Lum)) +
  annotation_custom(img.rg,
                    xmin = -2,
                    xmax = 27,
                    ymin = -1,
                    ymax = 18) +
  geom_point(shape = 15, size = 2.5) +
  theme_void()
gp + coord_fixed(clip = "off") +
  theme(plot.margin = unit(c(3, 6, 5, 2), "lines"),
        legend.position = c(1.2, 0.5)) +
  scale_colour_gradientn(colours = pals::ocean.haline(100))
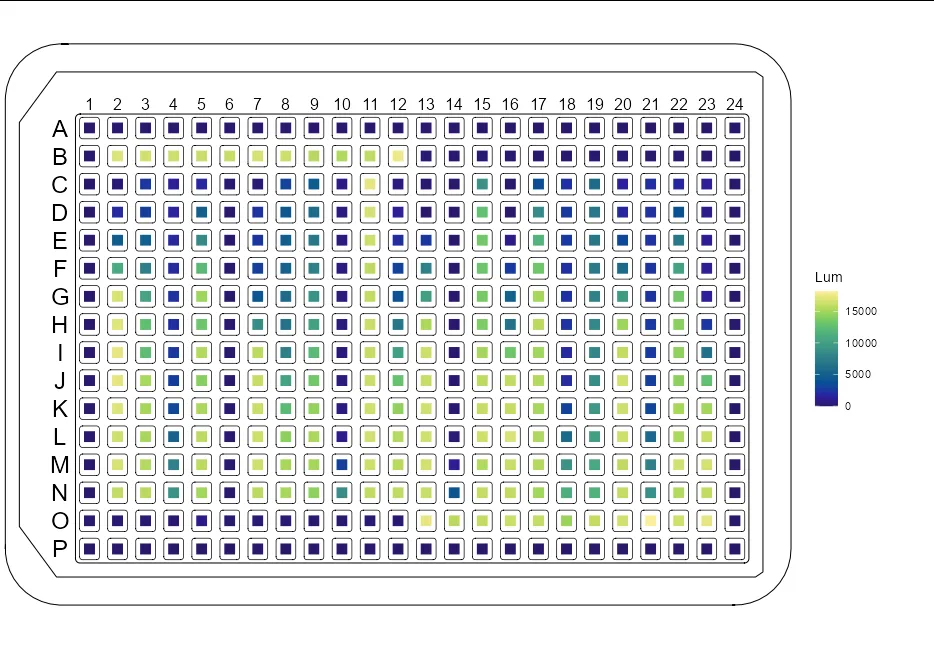
coord_fixed()将X:Y比例设置为1。 - Dan Adams