Cartopy + NetworkX:zorder无法工作

3
我需要使用
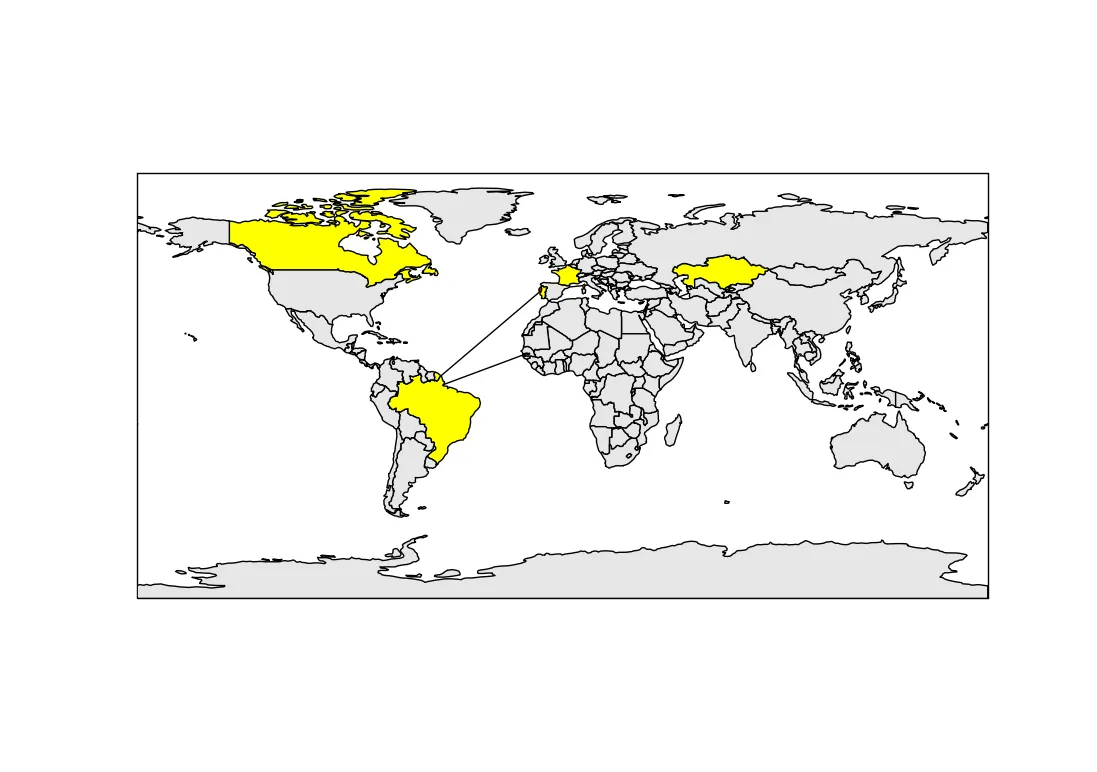
cartopy生成地图并在其上绘制一些数据(使用networkx)。我能够完成这个任务,但是networkx对象在地图后面。我尝试使用zorder强制层次顺序,但是...它不起作用:(
我的唯一想法是为cartopy几何形状添加一些透明度,但它看起来很不好...(在这个例子中,它看起来还不错,但是在我的所有数据中,它看起来很糟糕)
有什么方法可以强制顺序吗?
以下是我的代码:
import cartopy.crs as ccrs
from cartopy.io import shapereader as shpreader
import matplotlib.pyplot as plt
import networkx as nx

paises = ['Portugal', 'France', 'Canada', 'Brazil', 'Kazakhstan']
cidades = ['Aveiro', 'Ust-Kamenogorsk', 'Manaus']
links = [('Aveiro', 'Ust-Kamenogorsk'), 
         ('Manaus', 'Ust-Kamenogorsk'),
         ('Aveiro', 'Manaus')]
position = {'Aveiro': (-8.65, 40.6),
            'Manaus': (-60.0, -3.1),
            'Ust-Kamenogorsk': (82.6, 49.97)}

# map using cartopy:
shapename = 'admin_0_countries'
countries_shp = shpreader.natural_earth(resolution='110m',
                                    category='cultural', name=shapename)

ax = plt.axes(projection=ccrs.PlateCarree(central_longitude=0.0, globe=None))
ax.set_global()

for country in shpreader.Reader(countries_shp).records():    
    nome = country.attributes['name_long']
    if nome in paises:
        i = paises.index(nome)
        artist = ax.add_geometries(country.geometry, ccrs.PlateCarree(),
                           facecolor='yellow',
                           #alpha=0.5,
                           zorder=10)
    else:
        artist = ax.add_geometries(country.geometry, ccrs.PlateCarree(),
                           facecolor='0.9',
                           zorder=10)

# add some data over the cartopy map (using networkx):                              
G = nx.Graph()
G.add_nodes_from(cidades)
G.add_edges_from(links)

nx.draw_networkx_nodes(G, position, node_size=20, nodelist=cidades, zorder=20)
edges=nx.draw_networkx_edges(G, position, edgelist=links, zorder=20)

plt.show()

And this is the image I get: zorder not working with networkx over cartopy

3个回答

5
发生的情况是你的 zorder=20 没有任何作用;正如你可以在他们的源代码中看到的那样,它被忽略了。在 networkx 的 draw_networkx_edges 代码 中,他们所做的是:
def draw_networkx_edges(G, pos,
    ...
    edge_collection.set_zorder(1)  # edges go behind nodes
    ...

他们的draw_networkx_nodes代码中,包含如下内容:

def draw_networkx_nodes(G, pos,
    ...
    node_collection.set_zorder(2)
    ...

现在,解决方案非常简单:

  • If you set zorder in add_geometries to 1, nodes will then be in front of the map because it's zorder 2. But edges are still behind the map because it's zorder 1.
  • Now the real better solution is to get both node_collection and edge_collection first:

    nodes = nx.draw_networkx_nodes(G, position, node_size=20, nodelist=cidades)
    edges = nx.draw_networkx_edges(G, position, edgelist=links)
    

    Then set_zorder for both nodes and edges:

    nodes.set_zorder(20)
    edges.set_zorder(20)
    

太好了!谢谢你...下次我应该在源代码中寻找答案 :) - carla

3

如果您将添加到地图中的形状的zorder设置为0,则一切都可以正常工作。

ax.add_geometries(..., zorder=0)

enter image description here


0

这里是另一种方法

# Sort the nodes by degree
sorted_nodes = sorted(G.nodes, key=lambda x: G.degree(x))

# Draw edges
nx.draw_networkx_edges(G, pos, alpha=0.4, edge_color='gray', arrows=False, zorder=0)

# Draw nodes and labels with zorder based on the degree
for node in sorted_nodes:
    nx.draw_networkx_nodes(G, pos, nodelist=[node], node_color='skyblue', node_size=node_sizes[node], zorder=G.degree[node], ax=ax)
    nx.draw_networkx_labels(G, pos, labels={node: node}, font_size=9, font_color='black', bbox=def_bbox_props, zorder=G.degree[node] + 1, ax=ax)

网页内容由stack overflow 提供, 点击上面的
可以查看英文原文,
原文链接