Matlab中用于点簇的回归线

3
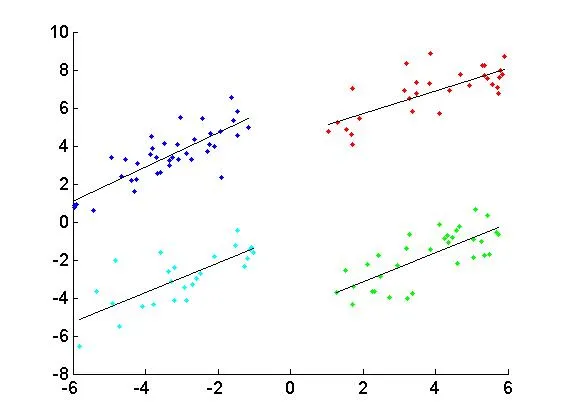
我可以在Matlab中通过一组x,y点绘制回归线。但是,如果我有一个点簇(如下图所示),假设我有四个点簇,并且我想为它们绘制四条回归线...我该怎么办?所有点都保存在x、y中。没有办法将它们分开并放入四个不同的变量集中。
请参见下面的图像。忽略图例和标签。您有什么想法如何在Matlab中实现这一点?如果只有一个聚类,我可以做到。但是我想同时为所有四个聚类进行操作。
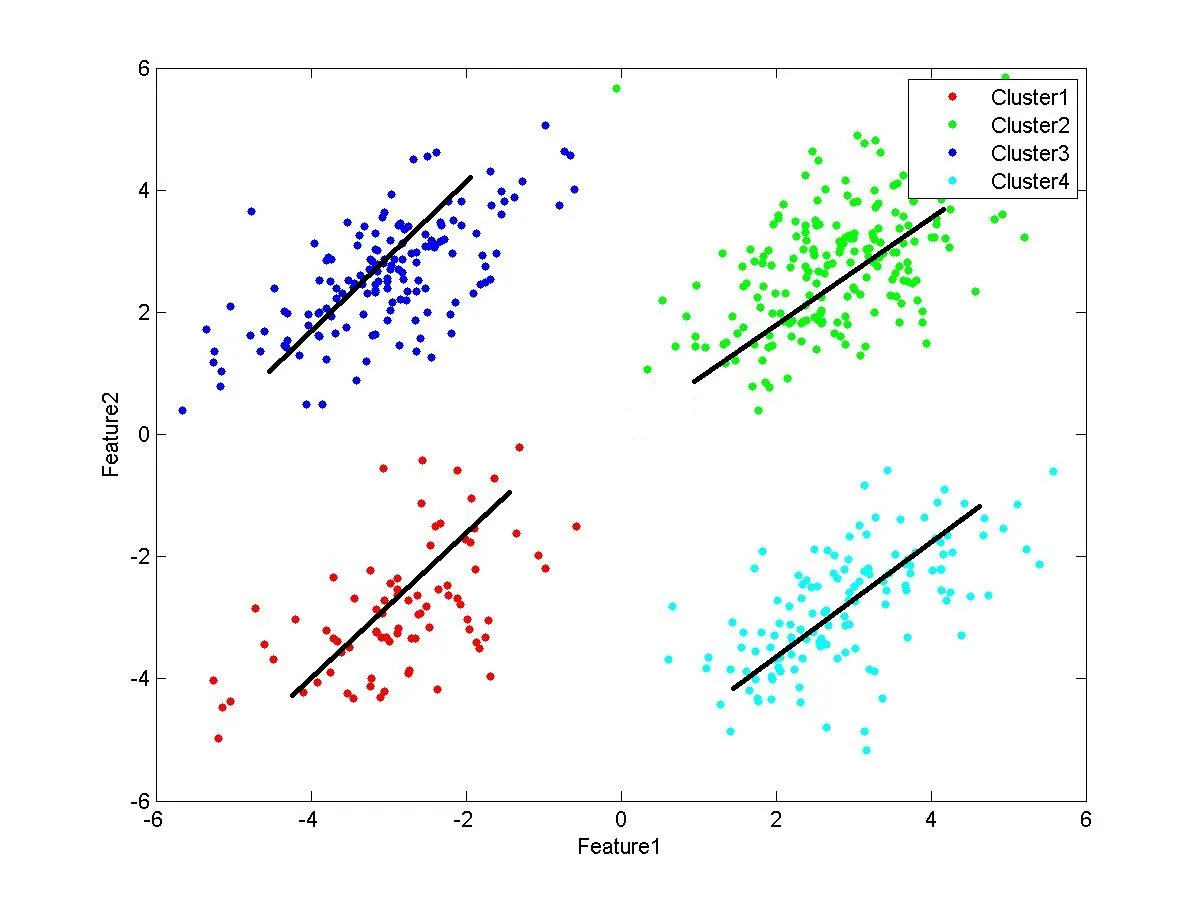
enter image description here 我现在在用于一个聚类的代码:
 %----------- Linear regression -----------------
 p= polyfit(x,y,1);
 f= polyval(p,x);
 %----------- Call R-square function ------------
 r2=Rsquare(x,y,p);


 %------------- Plot data -----------------------
 figure()
 plot(x,y,'*k');hold on
 plot(x,f,'-r'); % show linear fit
 xlabel('index');
 ylabel('Intensity a.u.');
 title('Test: Linear regreesion && R-square');
 %------- Show y-data on current figure ---------
 [row col]=size(y);
 for i=1:col
 str=num2str(y(i)); 
 text(x(i),y(i),str,'Color',[0 0 1]);
 end
 %--Show linear equation on current figure -------
 m1=num2str(p(1));c1=num2str(p(2));Rsquare1=num2str(r2(1));
 text(1.05,80,['y= ',m1,'x+',c1,' , R^2= ',Rsquare1,'.'],'FontSize',10,'FontName','Times New           Roman');

1
你可以发布一下你已经针对一个点集编写的代码吗? - darthbith
已添加到帖子中,请查看。 - ridctg
我可以做到。但这将是一项繁琐的工作。因为我的数据十分庞大。而且在这种手动工作中会出现错误。也许我现在无法使用矩阵索引。 - ridctg
如果您找不到将要拟合的值分离的方法,那么MATLAB就无法“自动”知道您想要做什么...您是如何将数据填充到“x,y”矩阵中的? - darthbith
这些值在csv文件中。我正在使用csvread函数...嗯...我不知道...我看到一些示例使用EM算法来识别点簇.... - ridctg
显示剩余3条评论
1个回答

4

您需要将值分成不同的簇。这是一个非常复杂的操作。例如,可以使用统计工具箱中的kmeans来完成此操作:

%// First, I generate some example data in 4 clusters. 

%// intercepts
a = [4 7  0 -5];

%// slopes
b = [0.7 1.0 1.0 0.8];

%// ranges
xmin = [+1  -6  -6  +1];
xmax = [+6  -1  -1  +6];

%// generate clusters 
N = [30 40 25 33];
X = arrayfun(@(ii) (xmax(ii)-xmin(ii))*rand(N(ii),1) + xmin(ii), 1:4, 'UniformOutput', false);
Y = arrayfun(@(ii) a(ii) + b(ii)*X{ii} + randn(size(X{ii})), 1:4, 'UniformOutput', false);


%// Unfortunately, your points not are given in 4 separate clusters, but 
%// in a single array:
X = cat(1,X{:});
Y = cat(1,Y{:});

%// Therefore, you'll have to separate the data again into clusters: 
idx = kmeans([X,Y], 4, 'Replicates', 2);

X = {
    X(idx==1)
    X(idx==2)
    X(idx==3)
    X(idx==4)
};

Y = {
    Y(idx==1)
    Y(idx==2)
    Y(idx==3)
    Y(idx==4)
};


%// Now perform regression on each cluster
ab = arrayfun(@(ii) [ones(size(X{ii})) X{ii}]\Y{ii}, 1:4, 'UniformOutput', false);

%// the original values, and the computed ones
%// note that the order is not the same!
[a; b]
[ab{:}]

%// Plot everything for good measure
figure(1), clf, hold on

plot(...
    X{1}, Y{1}, 'g.',...
    X{2}, Y{2}, 'b.',...
    X{3}, Y{3}, 'r.',...
    X{4}, Y{4}, 'c.')

line([min(X{1}); max(X{1})], ab{1}(1) + ab{1}(2)*[min(X{1}); max(X{1})], 'color', 'k')
line([min(X{2}); max(X{2})], ab{2}(1) + ab{2}(2)*[min(X{2}); max(X{2})], 'color', 'k')
line([min(X{3}); max(X{3})], ab{3}(1) + ab{3}(2)*[min(X{3}); max(X{3})], 'color', 'k')
line([min(X{4}); max(X{4})], ab{4}(1) + ab{4}(2)*[min(X{4}); max(X{4})], 'color', 'k')

结果:

ans =
    4.0000    7.0000         0   -5.0000
    0.7000    1.0000    1.0000    0.8000
ans =
   -4.6503    6.4531    4.5433   -0.6326
    0.7561    0.8916    0.5914    0.7712

enter image description here

考虑到不同的顺序(查看图中的颜色),鉴于我添加的大量噪声,这些结果确实是您所期望的。

请注意,本文中存在HTML标签,已保留。


嘿,感谢您提供的解决方案。它有一个问题。我有一些点是垂直分布的。因此,我想要针对特定情况将回归线设置为垂直方向。这可能吗?另外,我希望我的标记(点)是透明的...我找不到方法来实现它...如果您能帮忙,请告诉我... - ridctg

网页内容由stack overflow 提供, 点击上面的
可以查看英文原文,
原文链接