sample <-
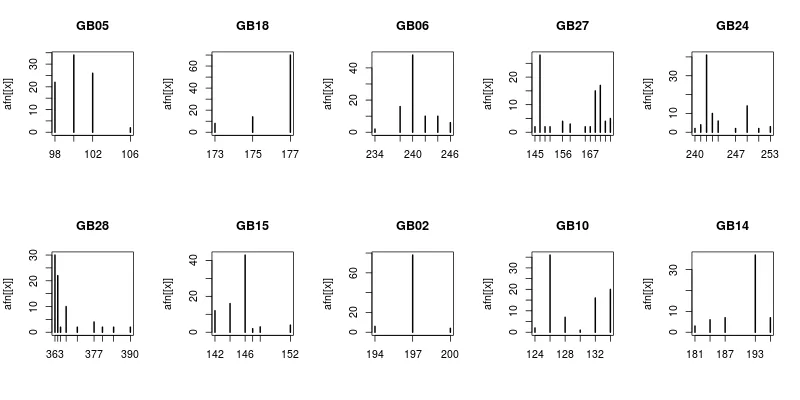
structure(list(GB05 = structure(c(22L, 34L, 26L, 2L), .Dim = 4L, .Dimnames = structure(list(
c("98", "100", "102", "106")), .Names = ""), class = "table"),
GB18 = structure(c(8L, 14L, 70L), .Dim = 3L, .Dimnames = structure(list(
c("173", "175", "177")), .Names = ""), class = "table"),
GB06 = structure(c(2L, 16L, 48L, 10L, 10L, 6L), .Dim = 6L, .Dimnames = structure(list(
c("234", "238", "240", "242", "244", "246")), .Names = ""), class = "table"),
GB27 = structure(c(2L, 28L, 2L, 2L, 4L, 3L, 2L, 2L, 15L,
17L, 4L, 5L), .Dim = 12L, .Dimnames = structure(list(c("145",
"147", "149", "151", "156", "159", "165", "167", "169", "171",
"173", "175")), .Names = ""), class = "table"), GB24 = structure(c(2L,
4L, 41L, 10L, 6L, 2L, 14L, 2L, 3L), .Dim = 9L, .Dimnames = structure(list(
c("240", "241", "242", "243", "244", "247", "249", "251",
"253")), .Names = ""), class = "table"), GB28 = structure(c(30L,
22L, 2L, 10L, 2L, 4L, 2L, 2L, 2L), .Dim = 9L, .Dimnames = structure(list(
c("363", "364", "365", "367", "371", "377", "380", "384",
"390")), .Names = ""), class = "table"), GB15 = structure(c(12L,
16L, 43L, 2L, 3L, 4L), .Dim = 6L, .Dimnames = structure(list(
c("142", "144", "146", "147", "148", "152")), .Names = ""), class = "table"),
GB02 = structure(c(6L, 78L, 4L), .Dim = 3L, .Dimnames = structure(list(
c("194", "197", "200")), .Names = ""), class = "table"),
GB10 = structure(c(2L, 36L, 7L, 1L, 16L, 20L), .Dim = 6L, .Dimnames = structure(list(
c("124", "126", "128", "130", "132", "134")), .Names = ""), class = "table"),
GB14 = structure(c(3L, 6L, 7L, 37L, 7L), .Dim = 5L, .Dimnames = structure(list(
c("181", "184", "187", "193", "196")), .Names = ""), class = "table")), .Names = c("GB05",
"GB18", "GB06", "GB27", "GB24", "GB28", "GB15", "GB02", "GB10",
"GB14"))
如何在这个lapply调用中使列表中的名称出现作为绘图标题(每个图一个标题)?
dev.new()
par(mfrow=c(2,5))
lapply(sample,function(x) plot(x,main=names[x]))
我不明白为什么main=names[x]无法工作。
dput输出没有正确地复制/粘贴。尝试复制时会出现错误。 - Arunsample <- dput(afn)。你不需要包含那个dput(afn)部分。 - A5C1D2H2I1M1N2O1R2T1