Matplotlib保存图像的性能问题,如何在循环中保存多个PNG文件

4
我希望找到一种优化以下情况的方法。我使用matplotlib的imshow创建了一个大的等高线图。然后,我想使用这个等高线图创建大量的png图像,其中每个图像都是通过更改x和y限制以及纵横比例从等高线图中获取的一小部分。
因此,在循环中没有绘图数据发生变化,只有轴限制和纵横比例在每个png图像之间发生变化。
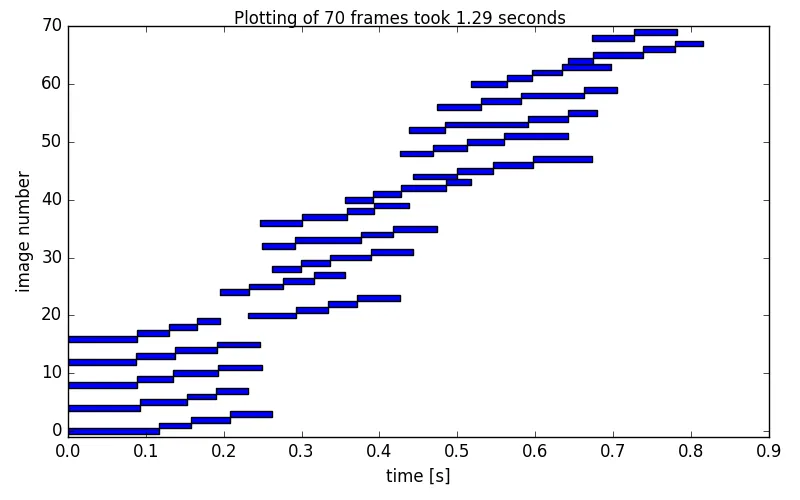
以下MWE在“figs”文件夹中创建了70个png图像,演示了简化的想法。约80%的运行时间用于fig.savefig('figs/'+filename)
我尝试了以下方法但没有得到改进:
  • 速度更快的matplotlib替代品--我很难找到类似要求的等高线/表面绘图的任何示例/文档
  • 多进程--我在这里看到的类似问题似乎要求在循环内调用fig = plt.figure()ax.imshow,因为无法将fig和ax序列化。在我的情况下,这将比实现多进程获得的任何速度增益更加昂贵。
如果您有任何见解或建议,我将不胜感激。
import numpy as np
import matplotlib as mpl
mpl.use('agg')
import matplotlib.pyplot as plt
import time, os

def make_plot(x, y, fix, ax):
    aspect = np.random.random(1)+y/2.0-x
    xrand = np.random.random(2)*x
    xlim = [min(xrand), max(xrand)]
    yrand = np.random.random(2)*y
    ylim = [min(yrand), max(yrand)]
    filename = '{:d}_{:d}.png'.format(x,y)

    ax.set_aspect(abs(aspect[0]))
    ax.set_xlim(xlim)
    ax.set_ylim(ylim)
    fig.savefig('figs/'+filename)

if not os.path.isdir('figs'):
    os.makedirs('figs')
data = np.random.rand(25, 25)

fig = plt.figure()
ax = fig.add_axes([0., 0., 1., 1.])
# in the real case, imshow is an expensive calculation which can't be put inside the loop
ax.imshow(data, interpolation='nearest')

tstart = time.clock()
for i in range(1, 8):
    for j in range(3, 13):
        make_plot(i, j, fig, ax)

print('took {:.2f} seconds'.format(time.clock()-tstart))
1个回答

4

由于在这种情况下的限制是对plt.savefig()函数的调用,因此它不能被大量优化。内部从头开始渲染图形需要一些时间。可能通过减少要绘制的顶点数来稍微减少时间。

在我的机器上运行您的代码所需的时间(Win 8,i5,4个核心,3.5GHz)为2.5秒。这似乎还不错。使用Multiprocessing可以获得一些改进。

关于Multiprocessing的说明:在multiprocessing中使用pyplot的状态机实际上能够工作,这可能令人惊讶。但确实如此。在这种情况下,由于每个图像都基于相同的图形和轴对象,因此甚至无需创建新的图形和轴。

我修改了我之前在这里给出的答案以适应您的情况,并且使用了multiprocessing和4个核心上的5个进程,总时间大约减少了一半。我附加了一个条形图,显示了多处理的效果。

import numpy as np
#import matplotlib as mpl
#mpl.use('agg') # use of agg seems to slow things down a bit
import matplotlib.pyplot as plt
import multiprocessing
import time, os

def make_plot(d):
    start = time.clock()
    x,y=d
    #using aspect in this way causes a warning for me
    #aspect = np.random.random(1)+y/2.0-x 
    xrand = np.random.random(2)*x
    xlim = [min(xrand), max(xrand)]
    yrand = np.random.random(2)*y
    ylim = [min(yrand), max(yrand)]
    filename = '{:d}_{:d}.png'.format(x,y)
    ax = plt.gca()
    #ax.set_aspect(abs(aspect[0]))
    ax.set_xlim(xlim)
    ax.set_ylim(ylim)
    plt.savefig('figs/'+filename)
    stop = time.clock()
    return np.array([x,y, start, stop])

if not os.path.isdir('figs'):
    os.makedirs('figs')
data = np.random.rand(25, 25)

fig = plt.figure()
ax = fig.add_axes([0., 0., 1., 1.])
ax.imshow(data, interpolation='nearest')


some_list = []
for i in range(1, 8):
    for j in range(3, 13):
        some_list.append((i,j))


if __name__ == "__main__":
    multiprocessing.freeze_support()
    tstart = time.clock()
    print tstart
    num_proc = 5
    p = multiprocessing.Pool(num_proc)

    nu = p.map(make_plot, some_list)

    tooktime = 'Plotting of {} frames took {:.2f} seconds'
    tooktime = tooktime.format(len(some_list), time.clock()-tstart)
    print tooktime
    nu = np.array(nu)

    plt.close("all")
    fig, ax = plt.subplots(figsize=(8,5))
    plt.suptitle(tooktime)
    ax.barh(np.arange(len(some_list)), nu[:,3]-nu[:,2], 
            height=np.ones(len(some_list)), left=nu[:,2],  align="center")
    ax.set_xlabel("time [s]")
    ax.set_ylabel("image number")
    ax.set_ylim([-1,70])
    plt.tight_layout()
    plt.savefig(__file__+".png")
    plt.show()

enter image description here


网页内容由stack overflow 提供, 点击上面的
可以查看英文原文,
原文链接