如何在保持表面图透明的同时,将3D散点图与3D曲面图结合起来,以便仍然能够看到所有的点?
3个回答
20
要在同一张图中组合不同类型的绘图,您应该使用函数
plt.hold(True)。
以下代码绘制了一个3D散点图和一个3D曲面图:
from mpl_toolkits.mplot3d import *
import matplotlib.pyplot as plt
import numpy as np
from random import random, seed
from matplotlib import cm


fig = plt.figure()
ax = fig.gca(projection='3d')               # to work in 3d
plt.hold(True)

x_surf=np.arange(0, 1, 0.01)                # generate a mesh
y_surf=np.arange(0, 1, 0.01)
x_surf, y_surf = np.meshgrid(x_surf, y_surf)
z_surf = np.sqrt(x_surf+y_surf)             # ex. function, which depends on x and y
ax.plot_surface(x_surf, y_surf, z_surf, cmap=cm.hot);    # plot a 3d surface plot

n = 100
seed(0)                                     # seed let us to have a reproducible set of random numbers
x=[random() for i in range(n)]              # generate n random points
y=[random() for i in range(n)]
z=[random() for i in range(n)]
ax.scatter(x, y, z);                        # plot a 3d scatter plot

ax.set_xlabel('x label')
ax.set_ylabel('y label')
ax.set_zlabel('z label')

plt.show()
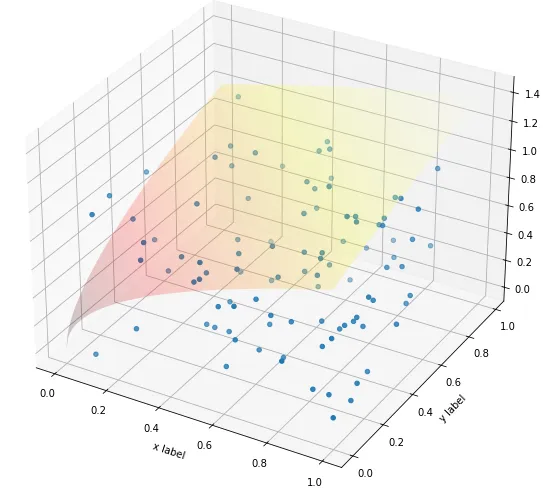
结果:
您可以在此处查看一些带有3D图的其他示例:
http://matplotlib.org/mpl_toolkits/mplot3d/tutorial.html
我将表面绘图的颜色从默认更改为了“hot”颜色映射,以区分两个图的颜色 - 现在,可以看到表面绘图覆盖了散点图,而不受顺序的影响...
编辑:为解决这个问题,应该在表面绘图的颜色映射中使用透明度;添加以下代码: Transparent colormap 并更改以下行:
ax.plot_surface(x_surf, y_surf, z_surf, cmap=cm.hot); # plot a 3d surface plot
到
ax.plot_surface(x_surf, y_surf, z_surf, cmap=theCM);
我们得到:
- sissi_luaty
5
19
使用来自这个answer的代码;而不是通过
cmap=theCM命令来设置透明度,更容易调整alpha值。ax.plot_surface(x_surf, y_surf, z_surf, cmap=cm.hot, alpha=0.2)
- StevilP
3
我想知道是否有类似alpha的东西,你的评论让这一点显而易见! - bzm3r
2有人知道如何使散点图的点亮而可见,而不需要设置低透明度吗? - Aerinmund Fagelson
3一位matplotlib开发者撰写的帖子:这是mplot3d的已知限制。它不是真正的3D渲染工具包,而是受到matplotlib分层引擎的限制。每个艺术家都有一个单独的zorder值,确定艺术家和集合绘制的顺序。因此,在一般情况下,混合3D场景的渲染是不可能的,因为表面艺术家或散点艺术家必须在另一个之前绘制。 - Baumann
0
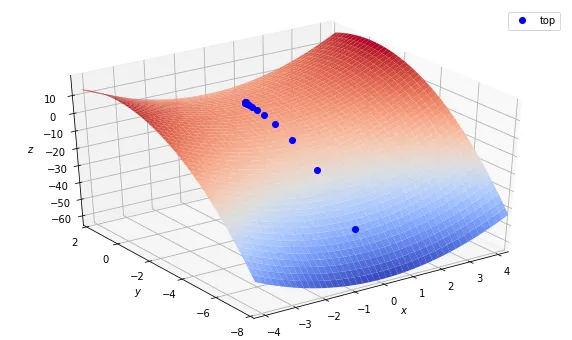
如其他人所述,如果您想要一个透明的3D图形,只需提供alpha参数:
  # elve, azim are custom viewpoint/angle
  ax = plt.axes(projection='3d', elev=35, azim=-125)
  ax.plot_surface(x, y, z, alpha=0.7)
  ax.plot(scatter_x, scatter_y, scatter_z, 'b.', markersize=10, label='top')
这将会给出:

如果您想在三维图形上方绘制点,请使用 zorder。例如,以下代码将生成:
  ax = plt.axes(projection='3d', elev=35, azim=-125)
  ax.plot_surface(x, y, z, cmap=plt.cm.coolwarm, linewidth=0.1, zorder=1)
  ax.plot(scatter_x, scatter_y, scatter_z, 'b.', markersize=10, label='top', zorder=4)
- Iman Mirzadeh
网页内容由stack overflow 提供, 点击上面的可以查看英文原文,
原文链接
原文链接
zorder参数仍然适用于3D线条。这有点混乱,但我已经通过迭代点并将它们单独绘制为从点到自身的线条,在表面图的顶部绘制了散点图。 - RGWinston