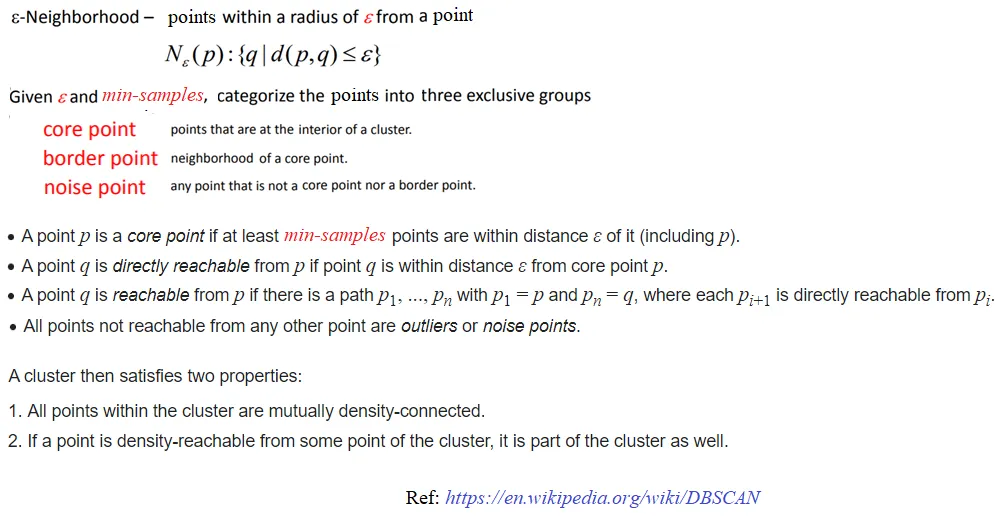
首先,让我们了解一些关于DBSCAN密度聚类的基础知识,下图总结了基本概念。
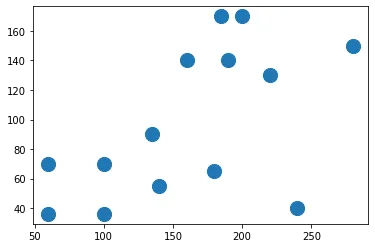
 接下来,让我们创建一个2D样本数据集,用DBSCAN进行聚类。以下图展示了数据集的外观。
import numpy as np
import matplotlib.pylab as plt
from sklearn.cluster import DBSCAN

X_train = np.array([[60,36], [100,36], [100,70], [60,70],
    [140,55], [135,90], [180,65], [240,40],
    [160,140], [190,140], [220,130], [280,150],
    [200,170], [185, 170]])
plt.scatter(X_train[:,0], X_train[:,1], s=200)
plt.show()
现在让我们使用scikit-learn的DBSCAN实现进行聚类:
eps = 45
min_samples = 4
db = DBSCAN(eps=eps, min_samples=min_samples).fit(X_train)
labels = db.labels_
labels
db.core_sample_indices_
从上面的结果可以看出:
- 算法找到了6个核心点
- 找到了2个簇(标签为0、1)和一些离群点(噪声点)。
让我们使用以下代码片段来可视化这些簇:
def dist(a, b):
    return np.sqrt(np.sum((a - b)**2))

colors = ['r', 'g', 'b', 'k']
for i in range(len(X_train)):
    plt.scatter(X_train[i,0], X_train[i,1],
                s=300, color=colors[labels[i]],
                marker=('*' if i in db.core_sample_indices_ else 'o'))

    for j in range(i+1, len(X_train)):
        if dist(X_train[i], X_train[j])  < eps:
            plt.plot([X_train[i,0], X_train[j,0]], [X_train[i,1], X_train[j,1]], '-', color=colors[labels[i]])

plt.title('Clustering with DBSCAN', size=15)
plt.show()
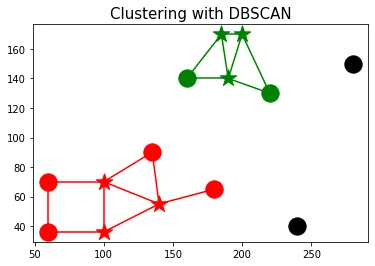
- 聚类0中的点被标记为红色。
- 聚类1中的点被标记为绿色。
- 异常值被标记为黑色。
- 核心点用*标记。
- 如果两个点在ϵ邻域内,则它们之间连接一条边。
最后,让我们实现predict()方法来预测新数据点的聚类。实现基于以下内容:
in order that the new point x belongs to a cluster, it must be directly density reachable from a core point in the cluster.
We shall compute the nearest core point to the cluster, if it's within ϵ distance from x, we shall return the label of the core point, otherwise the point x will be declared a noise point (outlier).
Notice that this differs from the training algorithm, since we no longer allow any more point to become a new core point (i.e., number of core points are fixed).
the next code snippet implements the predict() function based on the above idea
def predict(db, x):
dists = np.sqrt(np.sum((db.components_ - x)**2, axis=1))
i = np.argmin(dists)
return db.labels_[db.core_sample_indices_[i]] if dists[i] < db.eps else -1
X_test = np.array([[100, 100], [160, 160], [60, 130]])
for i in range(len(X_test)):
print('test point: {}, predicted label: {}'.format(X_test[i],
predict(db, X_test[i])))
下面的动画展示了如何使用上面定义的
predict()函数标记一些新的测试点。