我想在绘图中添加一个geom_text(),其中包含一个LaTeX公式,用于描述2个矩阵中每个值的平均百分比:
library(latex2exp)
library(ggplot2)
library(tidyverse)


percentage <- matrix(c(10,100,90,80,100,97,80,19,90,82,9,87),nrow=2)
colnames(percentage) <- c("value1","value2","value3","value4","value5","value6")
rownames(percentage) <- c("matrix1", "matrix2")
mean_p <- apply(percentage,2,mean)
mat <- c("matrix1", "matrix2")


percentage %>%
  as_data_frame() %>%
  gather(., Value , Percentage) %>%
  ggplot(., aes(x=Value,y=Percentage,color=rep(mat,ncol(percentage)))) +
  geom_bar(position = position_dodge(width = 0.8), stat = "identity", fill = "white")`
我尝试添加
标签
lab <- character()
for(i in 1:ncol(percentage)){
lab <- c(lab,"",sprintf('$\\oslash%s$',mean_p[i]))
}
geom_text(aes(label=lapply(lab,TeX)),vjust=0,show.legend = FALSE,color="lightblue")
但是这个方法不能正确地转换Latex表达式。有没有人有解决这个问题的想法?
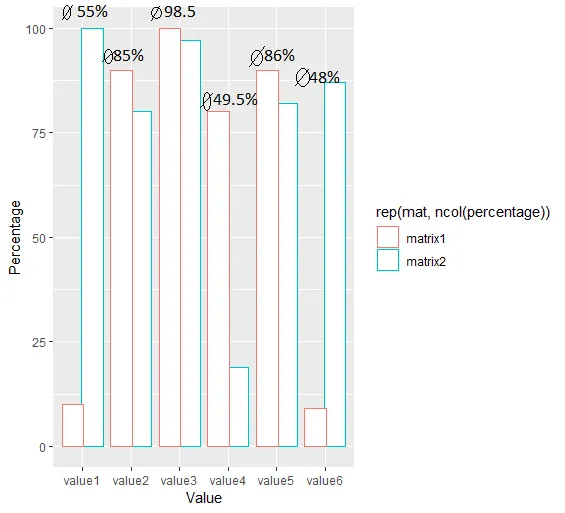
我要生成的输出应该像这样: