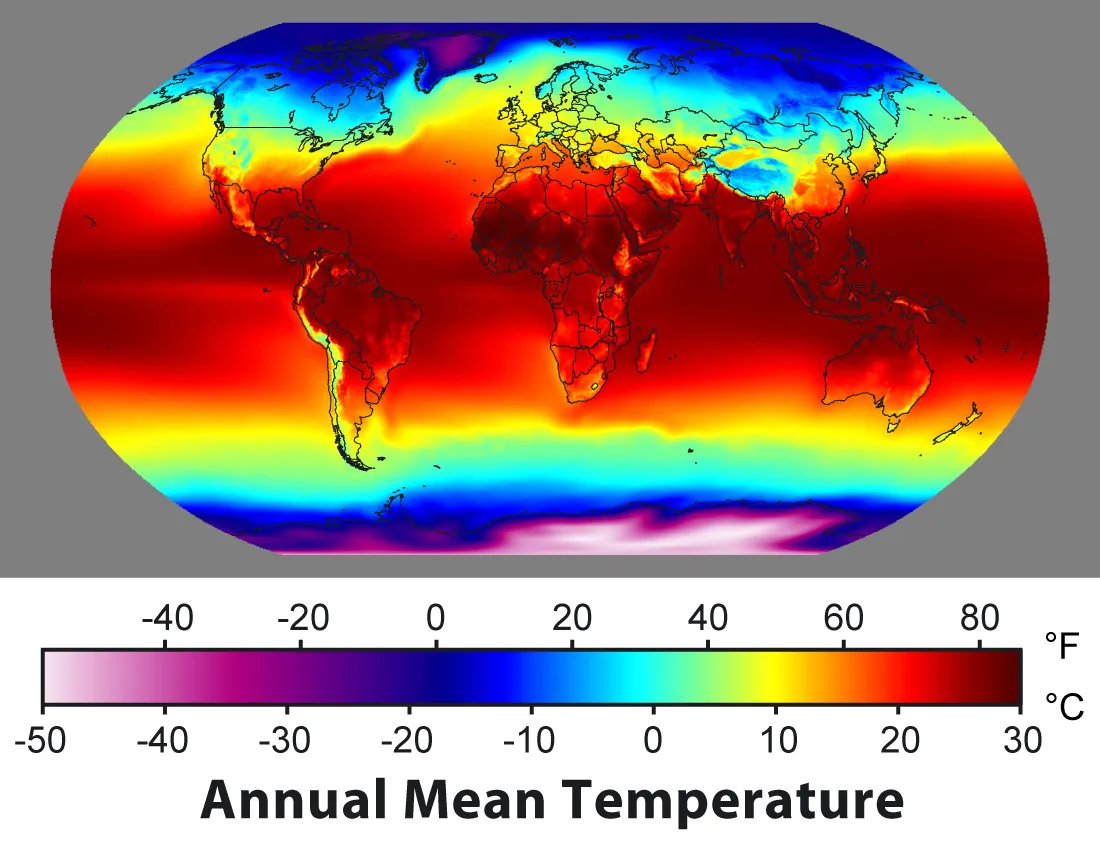
我们希望将未知范围内的正整数转换为经过缩放的范围,并使用RGB值在热力图中显示。希望这样说清楚了。谢谢!
我想澄清的是,最小/最大值需要“插入”公式中。
首先需要找到这些值的范围来获取最小值和最大值。然后需要创建一个类似于下面图片下方的颜色标度。可以尝试使用不同的函数来将整数映射到RGB。你需要3个函数 R(X),G(X),B(X)。从下面的图像来看,B(X)在中间达到峰值,R(X)在末尾达到峰值,绿色则出现在其他地方。只要确保您永远不会为某个X的值获得两个RGB,那么您就完成了转换。
(来源:globalwarmingart.com)
编辑: 想一想,您可以对YUV空间周围的一些单位圆进行采样。 alt text http://www.biocrawler.com/w/images/e/ec/Yuv.png
或者只需下载高分辨率的彩色条并对其进行采样。
编辑2: 我刚刚面临着颜色条生成问题,并想起了MATLAB/Octave颜色条代码。我绘制了他们的数据并得到了以下图像。
您想将数据值转换为光的频率:
可见光频率从大约350nm(紫色)到650nm(红色):
(来源: gamonline.com)
以下函数将指定范围内的数字转换为可见光的范围,然后获取rgb值:
function DataPointToColor(Value, MinValue, MaxValue: Real): TColor;
var
r, g, b: Byte;
WaveLength: Real;
begin
WaveLength := GetWaveLengthFromDataPoint(Value, MinValue, MaxValue);
WavelengthToRGB(Wavelength, r, g, b);
Result := RGB(r, g, b);
end;
我头脑中写的函数如下:
function GetWaveLengthFromDataPoint(Value: Real; MinValues, MaxValues: Real): Real;
const
MinVisibleWaveLength = 350.0;
MaxVisibleWaveLength = 650.0;
begin
//Convert data value in the range of MinValues..MaxValues to the
//range 350..650
Result := (Value - MinValue) / (MaxValues-MinValues) *
(MaxVisibleWavelength - MinVisibleWavelength) +
MinVisibleWaveLength;
end;
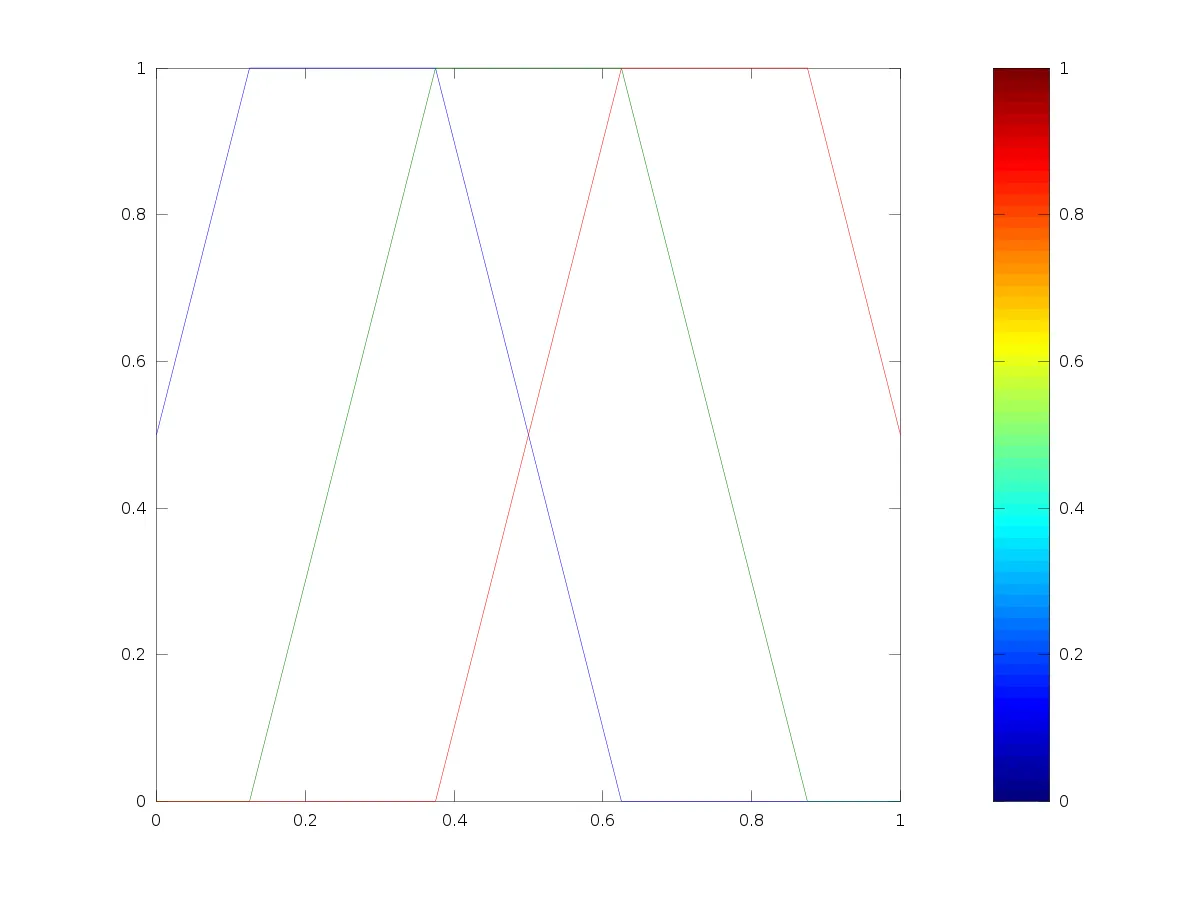
我在网上找到了一个函数, 可以将波长转换为RGB:
PROCEDURE WavelengthToRGB(CONST Wavelength: Nanometers;
VAR R,G,B: BYTE);
CONST
Gamma = 0.80;
IntensityMax = 255;
VAR
Blue : DOUBLE;
factor : DOUBLE;
Green : DOUBLE;
Red : DOUBLE;
FUNCTION Adjust(CONST Color, Factor: DOUBLE): INTEGER;
BEGIN
IF Color = 0.0
THEN RESULT := 0 // Don't want 0^x = 1 for x <> 0
ELSE RESULT := ROUND(IntensityMax * Power(Color * Factor, Gamma))
END {Adjust};
BEGIN
CASE TRUNC(Wavelength) OF
380..439:
BEGIN
Red := -(Wavelength - 440) / (440 - 380);
Green := 0.0;
Blue := 1.0
END;
440..489:
BEGIN
Red := 0.0;
Green := (Wavelength - 440) / (490 - 440);
Blue := 1.0
END;
490..509:
BEGIN
Red := 0.0;
Green := 1.0;
Blue := -(Wavelength - 510) / (510 - 490)
END;
510..579:
BEGIN
Red := (Wavelength - 510) / (580 - 510);
Green := 1.0;
Blue := 0.0
END;
580..644:
BEGIN
Red := 1.0;
Green := -(Wavelength - 645) / (645 - 580);
Blue := 0.0
END;
645..780:
BEGIN
Red := 1.0;
Green := 0.0;
Blue := 0.0
END;
ELSE
Red := 0.0;
Green := 0.0;
Blue := 0.0
END;
// Let the intensity fall off near the vision limits
CASE TRUNC(Wavelength) OF
380..419: factor := 0.3 + 0.7*(Wavelength - 380) / (420 - 380);
420..700: factor := 1.0;
701..780: factor := 0.3 + 0.7*(780 - Wavelength) / (780 - 700)
ELSE factor := 0.0
END;
R := Adjust(Red, Factor);
G := Adjust(Green, Factor);
B := Adjust(Blue, Factor)
END {WavelengthToRGB};
示例用法:
数据集在10到65,000,000的范围内。而这个特定的数据点的值为638,328:
color = DataPointToColor(638328, 10, 65000000);
颜色条功能
// value between 0 and 1 (percent)
function color(value) {
var RGB = {R:0,G:0,B:0};
// y = mx + b
// m = 4
// x = value
// y = RGB._
if (0 <= value && value <= 1/8) {
RGB.R = 0;
RGB.G = 0;
RGB.B = 4*value + .5; // .5 - 1 // b = 1/2
} else if (1/8 < value && value <= 3/8) {
RGB.R = 0;
RGB.G = 4*value - .5; // 0 - 1 // b = - 1/2
RGB.B = 1; // small fix
} else if (3/8 < value && value <= 5/8) {
RGB.R = 4*value - 1.5; // 0 - 1 // b = - 3/2
RGB.G = 1;
RGB.B = -4*value + 2.5; // 1 - 0 // b = 5/2
} else if (5/8 < value && value <= 7/8) {
RGB.R = 1;
RGB.G = -4*value + 3.5; // 1 - 0 // b = 7/2
RGB.B = 0;
} else if (7/8 < value && value <= 1) {
RGB.R = -4*value + 4.5; // 1 - .5 // b = 9/2
RGB.G = 0;
RGB.B = 0;
} else { // should never happen - value > 1
RGB.R = .5;
RGB.G = 0;
RGB.B = 0;
}
// scale for hex conversion
RGB.R *= 15;
RGB.G *= 15;
RGB.B *= 15;
return Math.round(RGB.R).toString(16)+''+Math.round(RGB.G).toString(16)+''+Math.round(RGB.B).toString(16);
}
r = min(max(0, 1.5-abs(1-4*(val-0.5))),1);
g = min(max(0, 1.5-abs(1-4*(val-0.25))),1);
b = min(max(0, 1.5-abs(1-4*val)),1);
// scale colour temp relatively
function getColourTemp(maxVal, minVal, actual) {
var midVal = (maxVal - minVal)/2;
var intR;
var intG;
var intB = Math.round(0);
if (actual >= midVal){
intR = 255;
intG = Math.round(255 * ((maxVal - actual) / (maxVal - midVal)));
}
else{
intG = 255;
intR = Math.round(255 * ((actual - minVal) / (midVal - minVal)));
}
return to_rgb(intR, intG, intB);
}
继承Ian Boyd的优秀回答,我需要一组可以区分的颜色来构建热图。关键是找到一种区分接近颜色的方法,我通过将颜色转换为HSV并根据值变化V来找到了一种解决方案,在颜色范围中间稍微强调一下以突出黄色和橙色。
以下是代码:
Imports System.Drawing
Imports RGBHSV
Module HeatToColour_
' Thanks to Ian Boyd's excellent post here:
' https://dev59.com/W3E95IYBdhLWcg3wSb_P
Private Const MinVisibleWaveLength As Double = 450.0
Private Const MaxVisibleWaveLength As Double = 700.0
Private Const Gamma As Double = 0.8
Private Const IntensityMax As Integer = 255
Function HeatToColour(ByVal value As Double, ByVal MinValue As Double, ByVal MaxValues As Double) As System.Drawing.Color
Dim wavelength As Double
Dim Red As Double
Dim Green As Double
Dim Blue As Double
Dim Factor As Double
Dim scaled As Double
scaled = (value - MinValue) / (MaxValues - MinValue)
wavelength = scaled * (MaxVisibleWaveLength - MinVisibleWaveLength) + MinVisibleWaveLength
Select Case Math.Floor(wavelength)
Case 380 To 439
Red = -(wavelength - 440) / (440 - 380)
Green = 0.0
Blue = 1.0
Case 440 To 489
Red = 0.0
Green = (wavelength - 440) / (490 - 440)
Blue = 1.0
Case 490 To 509
Red = 0.0
Green = 1.0
Blue = -(wavelength - 510) / (510 - 490)
Case 510 To 579
Red = (wavelength - 510) / (580 - 510)
Green = 1.0
Blue = 0.0
Case 580 To 644
Red = 1.0
Green = -(wavelength - 645) / (645 - 580)
Blue = 0.0
Case 645 To 780
Red = 1.0
Green = 0.0
Blue = 0.0
Case Else
Red = 0.0
Green = 0.0
Blue = 0.0
End Select
' Let the intensity fall off near the vision limits
Select Case Math.Floor(wavelength)
Case 380 To 419
Factor = 0.3 + 0.7 * (wavelength - 380) / (420 - 380)
Case 420 To 700
Factor = 1.0
Case 701 To 780
Factor = 0.3 + 0.7 * (780 - wavelength) / (780 - 700)
Case Else
Factor = 0.0
End Select
Dim R As Integer = Adjust(Red, Factor)
Dim G As Integer = Adjust(Green, Factor)
Dim B As Integer = Adjust(Blue, Factor)
Dim result As Color = System.Drawing.Color.FromArgb(255, R, G, B)
Dim resulthsv As New HSV
resulthsv = ColorToHSV(result)
resulthsv.Value = 0.7 + 0.1 * scaled + 0.2 * Math.Sin(scaled * Math.PI)
result = HSVToColour(resulthsv)
Return result
End Function
Private Function Adjust(ByVal Colour As Double, ByVal Factor As Double) As Integer
If Colour = 0 Then
Return 0
Else
Return Math.Round(IntensityMax * Math.Pow(Colour * Factor, Gamma))
End If
End Function
End Module
Imports System.Drawing
Public Module RGBHSV
Public Class HSV
Sub New()
Hue = 0
Saturation = 0
Value = 0
End Sub
Public Sub New(ByVal H As Double, ByVal S As Double, ByVal V As Double)
Hue = H
Saturation = S
Value = V
End Sub
Public Hue As Double
Public Saturation As Double
Public Value As Double
End Class
Public Function ColorToHSV(ByVal color As Color) As HSV
Dim max As Integer = Math.Max(color.R, Math.Max(color.G, color.B))
Dim min As Integer = Math.Min(color.R, Math.Min(color.G, color.B))
Dim result As New HSV
With result
.Hue = color.GetHue()
.Saturation = If((max = 0), 0, 1.0 - (1.0 * min / max))
.Value = max / 255.0
End With
Return result
End Function
Public Function HSVToColour(ByVal hsv As HSV) As Color
Dim hi As Integer
Dim f As Double
With hsv
hi = Convert.ToInt32(Math.Floor(.Hue / 60)) Mod 6
f = .Hue / 60 - Math.Floor(.Hue / 60)
.Value = .Value * 255
Dim v As Integer = Convert.ToInt32(.Value)
Dim p As Integer = Convert.ToInt32(.Value * (1 - .Saturation))
Dim q As Integer = Convert.ToInt32(.Value * (1 - f * .Saturation))
Dim t As Integer = Convert.ToInt32(.Value * (1 - (1 - f) * .Saturation))
If hi = 0 Then
Return Color.FromArgb(255, v, t, p)
ElseIf hi = 1 Then
Return Color.FromArgb(255, q, v, p)
ElseIf hi = 2 Then
Return Color.FromArgb(255, p, v, t)
ElseIf hi = 3 Then
Return Color.FromArgb(255, p, q, v)
ElseIf hi = 4 Then
Return Color.FromArgb(255, t, p, v)
Else
Return Color.FromArgb(255, v, p, q)
End If
End With
End Function
End Module
以下是显示欧洲经济共同体国家人均GDP的热力图:
老兄,你可以使用 YUV 颜色空间,并且只为演示目的将其转换为 RGB。
http://www.cs.rit.edu/~ncs/color/t_convert.html
然而,我不得不更改这些行
h /= 60;
i = floor ( h );
到
h *= 5;
i = (int) h;
获取一个经过整个光谱的输出。
简单算法
// given a max and min value
float red,green,blue;
float range=max-min;
float mid=(max+min)/2.0;
//foreach value
red = (value[ii]-mid)/range;
if (red>0.0) {
//above mid = red-green
blue=0.0;
green = 1.0-red;
} else {
// lower half green-blue
blue=-red;
green = 1.0-blue;
red=0.0;
}
}
// assume equally distributed around 0 so max is the largest (or most negative number)
float range = log(fabs(max));
float mid=0.0
// foreach value
if (value[ii] > 0.0 ) {
// above mid = red-green
red = log(value[ii])/range;
blue=0.0;
green = 1.0 - red;
} else {
// below mid = green-blue
blue=-log(value[ii])/range;
green = 1.0 - blue;
red = 0.0;
}
注意 - 我还没有测试过这段代码,只是在构思想法!