我想在plotnine中的一条线上添加标签。当使用geom_text时,我会收到以下错误提示:
'NoneType' object has no attribute 'copy'
Sample code below:
df = pd.DataFrame({
    'date':pd.date_range(start='1/1/1996', periods=4*25, freq='Q'),
    'small': pd.Series([0.035]).repeat(4*25) ,
    'large': pd.Series([0.09]).repeat(4*25),
})


fig1 = (ggplot()
    + geom_step(df, aes(x='date', y='small'))
    + geom_step(df, aes(x='date', y='large'))
    + scale_x_datetime(labels=date_format('%Y'))
    + scale_y_continuous(labels=lambda l: ["%d%%" % (v * 100) for v in l])
    + labs(x=None, y=None)
    + geom_text(aes(x=pd.Timestamp('2000-01-01'), y = 0.0275, label = 'small'))
)

print(fig1)
编辑:
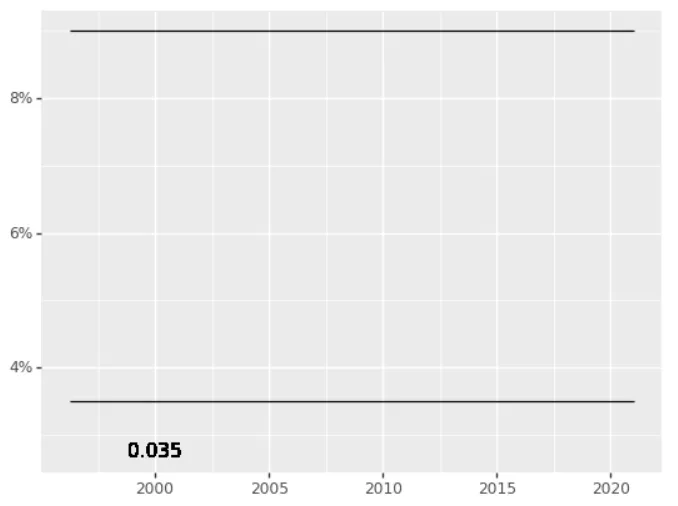
下面has2k1的答案解决了错误,但我得到了:
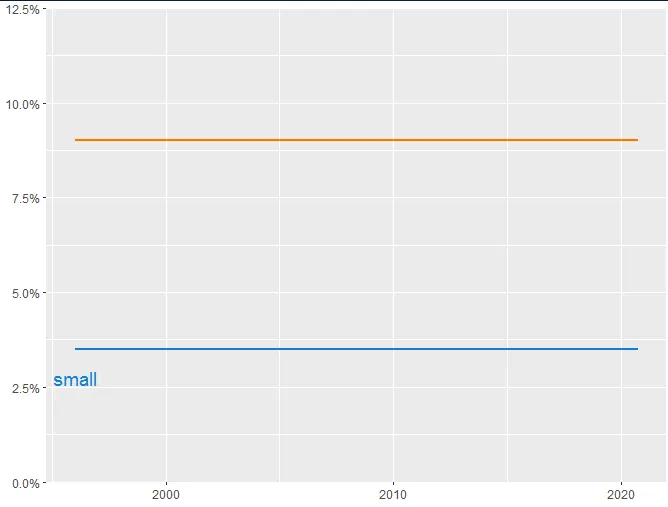
我想要这个:(来自R)
R代码:
ggplot() +
  geom_step(data=df, aes(x=date, y=small), color='#117DCF', size=0.75) +
  geom_step(data=df, aes(x=date, y=large), color='#FF7605', size=0.75) +
  scale_y_continuous(labels = scales::percent, expand = expand_scale(), limits = c(0,0.125)) +
  labs(x=NULL, y=NULL) +
  geom_text(aes(x = as.Date('1996-01-07'), y = 0.0275, label = 'small'), color = '#117DCF', size=5)
除了https://plotnine.readthedocs.io/en/stable/index.html之外,还有其他关于编程的文档吗?我已经阅读了geom_text的相关内容,但仍无法得到我所需的结果...


aes()文档尝试了解,但需要对Python有很好的掌握才能推断出这些问题。解决方案是专门针对这个方面的教程。我已经添加了一个问题。 - has2k1