Python 绘图 - 堆叠图像切片

6
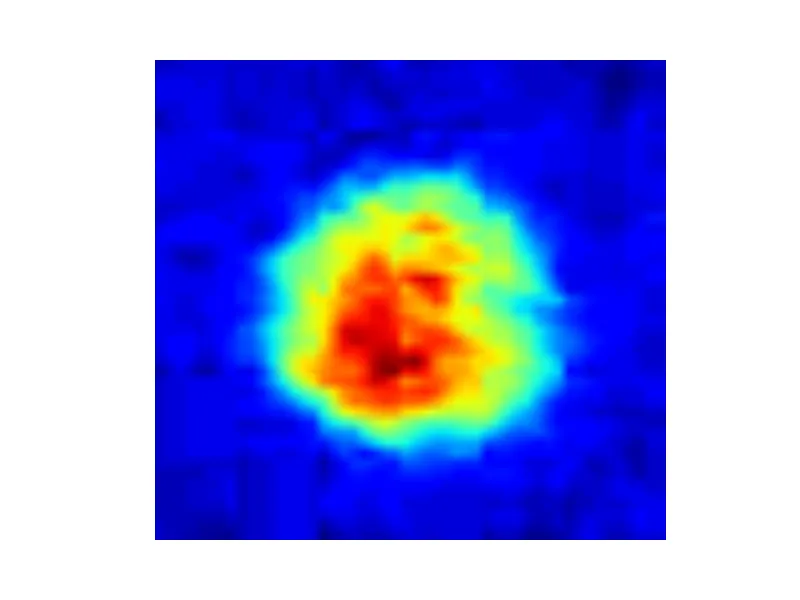
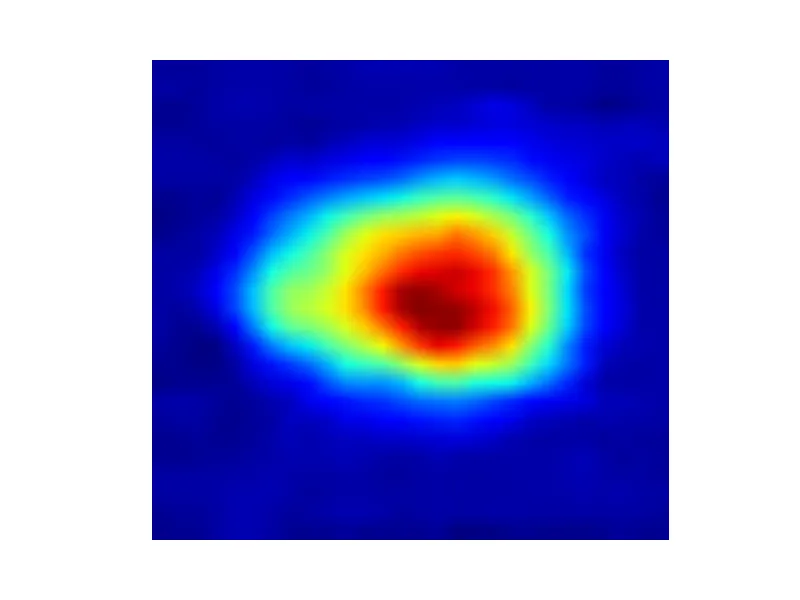
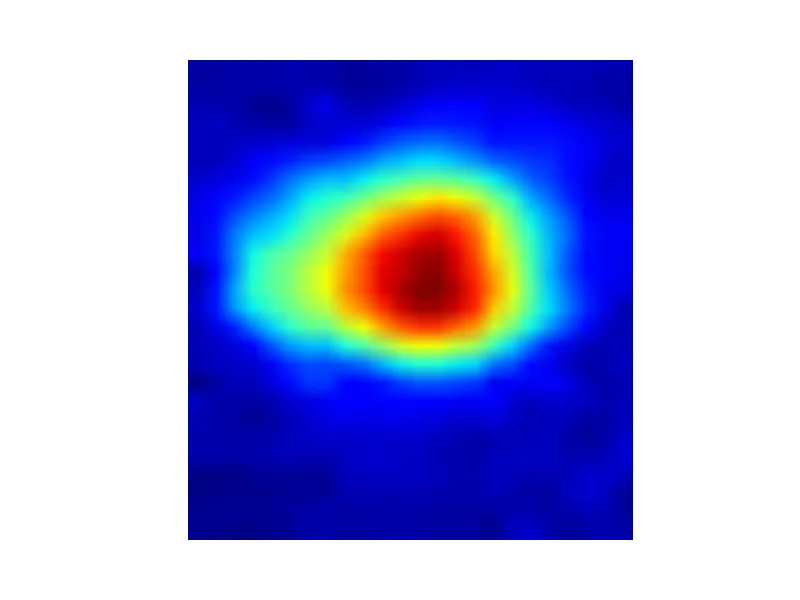
我有一系列基础的2D图像(现在简单起见只有3张),它们相互关联,类似于电影中的帧:

如何在Python中将这些切片叠加在一起,就像image1->image2->image-3?我正在使用pylab显示这些图像。理想情况下,堆叠帧的等轴视图或允许我在代码/渲染图像中旋转视图的工具都很好。
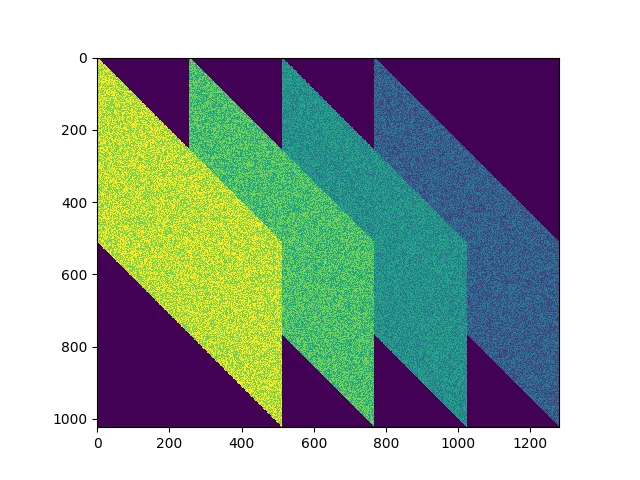
感谢您的任何帮助。以下是代码和图像:

from PIL import Image
import pylab
  
fileName = "image1.png"
im = Image.open(fileName)
pylab.axis('off')
pylab.imshow(im)
pylab.show()

Image1.png here Image2.png here Image3.png here


你还应该了解一下 
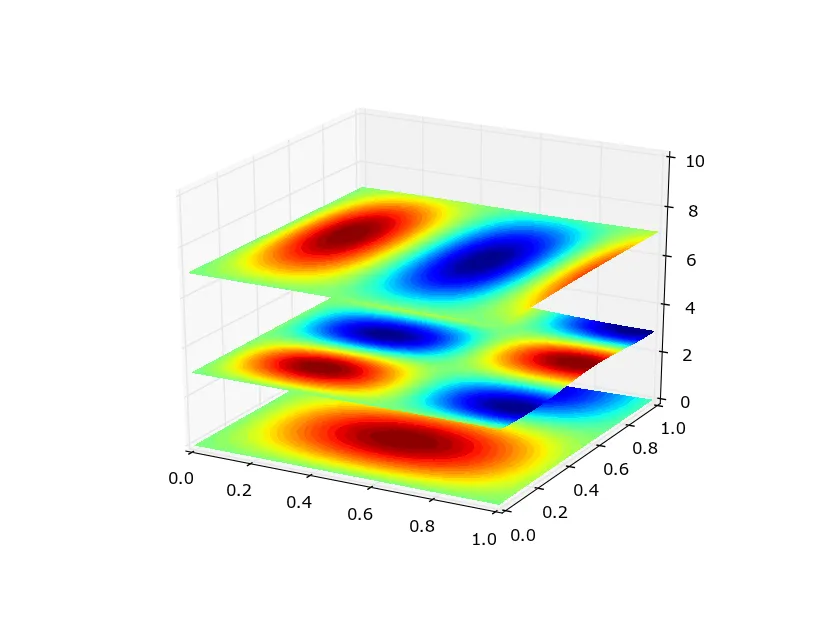
mayavi,它可以进行本地OpenGL渲染,并且具有更好的3D可视化工具。 - tacaswell
3个回答

11

如果这对你来说可行的话,你可以使用contourf,但无法通过imshow实现。不过这有点不太自然:

enter image description here

from mpl_toolkits.mplot3d import Axes3D
import numpy as np
import matplotlib.pyplot as plt

fig = plt.figure()
ax = fig.gca(projection='3d')

x = np.linspace(0, 1, 100)
X, Y = np.meshgrid(x, x)
Z = np.sin(X)*np.sin(Y)

levels = np.linspace(-1, 1, 40)

ax.contourf(X, Y, .1*np.sin(3*X)*np.sin(5*Y), zdir='z', levels=.1*levels)
ax.contourf(X, Y, 3+.1*np.sin(5*X)*np.sin(8*Y), zdir='z', levels=3+.1*levels)
ax.contourf(X, Y, 7+.1*np.sin(7*X)*np.sin(3*Y), zdir='z', levels=7+.1*levels)

ax.legend()
ax.set_xlim3d(0, 1)
ax.set_ylim3d(0, 1)
ax.set_zlim3d(0, 10)

plt.show()

3D实现的文档在这里

如ali_m建议,如果这对您不起作用,如果您能想象得到,可以使用VTk/MayaVi来完成它。


tom10,这段代码对于函数来说运行良好,但我无法将其应用于图像数据(我来自Matlab背景)。欢迎提供建议。 - Harry Lime
2
你需要理解轮廓图和图像之间的区别。你展示的图形明显是使用jet色图对某个单一值进行伪彩色处理后的假彩色图像。不要从z值绘制伪彩色图像,而是从z值绘制轮廓图。 - tom10

4

这是一种使用Matplotlib和剪切变换的完全愚蠢的方法(您可能需要进一步调整变换矩阵,以使堆叠的图像看起来正确):

import numpy as np
import matplotlib.pyplot as plt

from scipy.ndimage.interpolation import affine_transform


nimages = 4
img_height, img_width = 512, 512
bg_val = -1 # Some flag value indicating the background.

# Random test images.
rs = np.random.RandomState(123)
img = rs.randn(img_height, img_width)*0.1
images = [img+(i+1) for i in range(nimages)]

stacked_height = 2*img_height
stacked_width  = img_width + (nimages-1)*img_width/2
stacked = np.full((stacked_height, stacked_width), bg_val)

# Affine transform matrix.
T = np.array([[1,-1],
              [0, 1]])

for i in range(nimages):
    # The first image will be right most and on the "bottom" of the stack.
    o = (nimages-i-1) * img_width/2
    out = affine_transform(images[i], T, offset=[o,-o],
                           output_shape=stacked.shape, cval=bg_val)
    stacked[out != bg_val] = out[out != bg_val]

plt.imshow(stacked, cmap=plt.cm.viridis)
plt.show()

shear transform stack


4
据我所知,matplotlib没有像imshow那样的3D等效函数,可以在3D轴中将2D数组绘制为平面。但是,mayavi似乎正好有你需要的函数

mayavi.mlab.imshow中的堆叠是如何工作的?即:您如何将伪彩色图像放置在彼此上方? - Matthias
1
请参见以下链接:https://dev59.com/5mQm5IYBdhLWcg3wtAs_ 和 https://dev59.com/ZXfZa4cB1Zd3GeqPXu7m。 - ali_m

网页内容由stack overflow 提供, 点击上面的
可以查看英文原文,
原文链接