绘制 geom_sf 图形时无法删除网格线。

15

使用标准方法似乎无法在使用 geom_sf 时删除网格线。

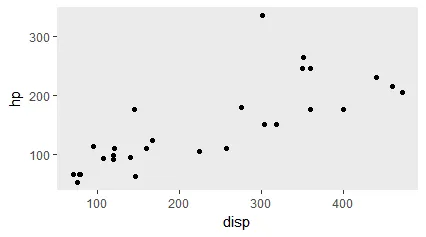
例如,如果我们绘制一个简单的 ggplot 对象,则可以使用此方法来去除网格线。

library(tidyverse)
library(sf)

mtcars %>%
  ggplot(
    aes(disp, hp)
  ) +
  geom_point() +
  theme(
    panel.grid.major = element_blank(),
    panel.grid.minor = element_blank()
  )

返回值

散点图无网格

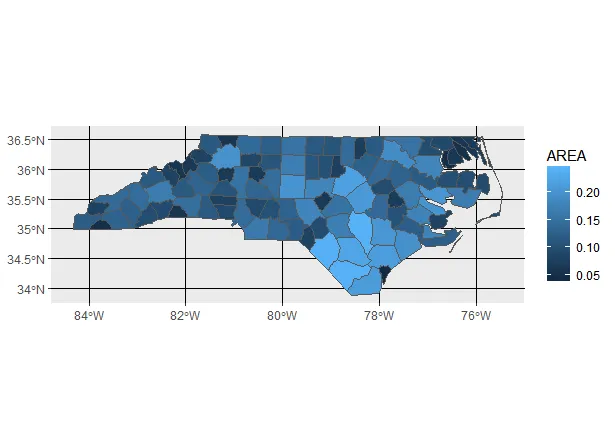
但是使用geom_sf绘制时,相同的代码无法去除网格线。

"shape/nc.shp" %>% 
  system.file(
    package = "sf"
  ) %>% 
  st_read(
    quiet = TRUE
    ) %>%
  ggplot() +
  geom_sf(aes(fill = AREA)) +
  theme(
    panel.grid.major = element_blank(),
    panel.grid.minor = element_blank()
  )

在此输入图片描述

3个回答


1

另一种去除网格线的方法是使用 scale_x_continuous 更改比例尺:

library(ggplot2)
world <- rnaturalearth::ne_countries(scale = "medium", returnclass = "sf")

crs_robinson = "+proj=robin +lon_0=0 +x_0=0 +y_0=0 +ellps=WGS84 +datum=WGS84 +units=m no_defs"

ggplot() + 
  geom_sf(data = world, color="grey70", fill="grey70")  +
  theme(panel.border=element_blank(),
        panel.grid = element_line(colour = "grey70", size=2),
        axis.text.x= element_blank(),
        axis.text.y = element_blank()) + 
  labs(title = str_c("Map of without gridlines") ,
       x = "",
       y = "") +
  scale_x_continuous(breaks = c(-180, 180)) +
  scale_y_continuous(breaks=c(-89.999, 89.999)) +
  coord_sf(crs = "+proj=robin +lon_0=0 +x_0=0 +y_0=0 +ellps=WGS84 +datum=WGS84 +units=m no_defs", expand = TRUE)no_defs", expand = TRUE)

PS:请注意,对于x scale_y_continuous(breaks=c(-90, 90))会出现错误。

enter image description here


0

ggplot() + geom_sf(data = data, colour = NA)


你的回答可以通过提供更多支持信息来改进。请编辑以添加进一步的细节,例如引用或文档,以便他人可以确认你的答案是正确的。您可以在帮助中心找到有关如何编写良好答案的更多信息。 - Community

网页内容由stack overflow 提供, 点击上面的
可以查看英文原文,
原文链接