我有两个数据集,一个是点(商店),一个是多边形(区域)。
由于我已经缓冲了这些多边形,所以在区域数据集中有时会出现重叠的多边形。
我想知道每个多边形是否有匹配的点?
joined = geopandas.sjoin(districts,shops, op='contains', how='inner')
joined
上面的代码可能只会给我匹配到的一个多边形。我该如何检查每个多边形呢?
我有两个数据集,一个是点(商店),一个是多边形(区域)。
由于我已经缓冲了这些多边形,所以在区域数据集中有时会出现重叠的多边形。
我想知道每个多边形是否有匹配的点?
joined = geopandas.sjoin(districts,shops, op='contains', how='inner')
joined
gpd.sjoin(districts, shops, how="left", op="contains") \
.reset_index()\
.rename(columns={"index": "districts"})\
.groupby(["districts"])\
.agg(nshops=("index_right", "nunique"), lshops=("index_right", "unique"))\
.astype(str)\
.replace("[nan]", "")
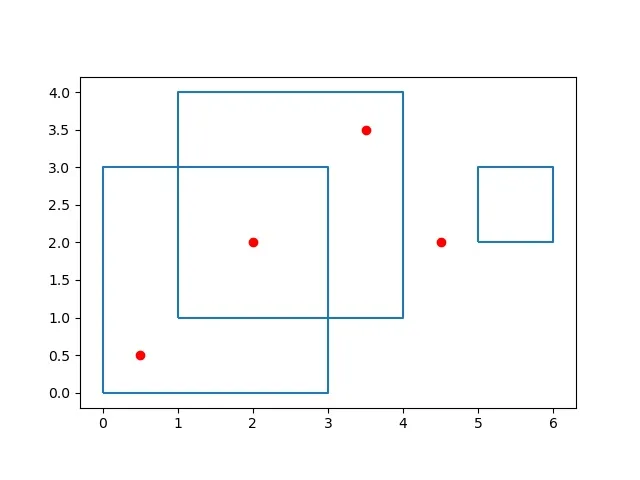
假设我们有三个区域(d1,d2和d3)。两个区域重叠(d1和d2)。我们有四家商店。 s1 在区域 d1 内,s2 在区域 d2 内。 s12 在区域 d1 和 d2 内。 s3 不在任何区域内。
我们使用 shapely 在 Python 中生成此几何图形:
from shapely.geometry import Point
from shapely.geometry import Polygon
import matplotlib.pyplot as plt
# Create Polygons for the districts
d1 = Polygon([(0, 0), (3, 0), (3, 3), (0, 3)])
d2 = Polygon([(1, 1), (4, 1), (4, 4), (1, 4)])
d3 = Polygon([(5, 2), (6, 2), (6, 3), (5, 3)])
# Create Points for the shops
s1 = Point(0.5, 0.5)
s2 = Point(3.5, 3.5)
s3 = Point(4.5, 2)
# This shop is in distric 1 and distric 2.
s12 = Point(2, 2)
import geopandas as gpd
import matplotlib.pyplot as plt
districts = gpd.GeoDataFrame(index=['d1', 'd2', 'd3'], geometry=[d1, d2, d3])
shops = gpd.GeoDataFrame(index=['s1', 's12', 's2', 's3'], geometry=[s1, s12, s2, s3])
ax = districts.boundary.plot()
shops.plot(ax=ax, color='red')
plt.show()
现在让我们来看看GeoPandas中如何使用空间连接。我们必须注意数据框的顺序,因为操作不是可交换的。这意味着gpd.sjoin(shops, districts, how="inner", op="contains")不等于gpd.sjoin(districts, shops, how="inner", op="contains")。
gpd.sjoin(shops, districts, how="left", op="contains")| 几何形状 | 索引_右 | |
|---|---|---|
| s1 | POINT (0.5 0.5) | nan |
| s12 | POINT (2 2) | nan |
| s2 | POINT (3.5 3.5) | nan |
| s3 | POINT (4.5 2) | nan |
将商店保留为索引,用 NaN 填充区域列。
gpd.sjoin(shops, districts, how="right", op="contains")| index_left | 几何图形 | |
|---|---|---|
| d1 | 未知值 | POLYGON ((0 0, 3 0, 3 3, 0 3, 0 0)) |
| d2 | 未知值 | POLYGON ((1 1, 4 1, 4 4, 1 4, 1 1)) |
| d3 | 未知值 | POLYGON ((5 2, 6 2, 6 3, 5 3, 5 2)) |
使用行政区作为索引,并将商铺列填充为空值NaN。
gpd.sjoin(shops, districts, how="inner", op="contains")| geometry | index_right |
|---|
这会返回一个空的数据框,因为点不能包含多边形。
gpd.sjoin(districts, shops, how="left", op="contains")| 几何图形 | 右侧索引 | |
|---|---|---|
| d1 | POLYGON ((0 0, 3 0, 3 3, 0 3, 0 0)) |
s1 |
| d1 | POLYGON ((0 0, 3 0, 3 3, 0 3, 0 0)) |
s12 |
| d2 | POLYGON ((1 1, 4 1, 4 4, 1 4, 1 1)) |
s12 |
| d2 | POLYGON ((1 1, 4 1, 4 4, 1 4, 1 1)) |
s2 |
| d3 | POLYGON ((5 2, 6 2, 6 3, 5 3, 5 2)) |
无 |
将行政区划保留为索引。
gpd.sjoin(districts, shops, how="right", op="contains")| index_left | geometry | |
|---|---|---|
| s1 | d1 | 点 (0.5 0.5) |
| s12 | d1 | 点 (2 2) |
| s12 | d2 | 点 (2 2) |
| s2 | d2 | 点 (3.5 3.5) |
| s3 | 无 | 点 (4.5 2) |
将商店保留为索引。
gpd.sjoin(districts, shops, how="inner", op="contains")| 几何图形 | 索引右侧 | |
|---|---|---|
| d1 | POLYGON ((0 0, 3 0, 3 3, 0 3, 0 0)) |
s1 |
| d1 | POLYGON ((0 0, 3 0, 3 3, 0 3, 0 0)) |
s12 |
| d2 | POLYGON ((1 1, 4 1, 4 4, 1 4, 1 1)) |
s12 |
| d2 | POLYGON ((1 1, 4 1, 4 4, 1 4, 1 1)) |
s2 |
与左侧获得的结果接近,将区域保留为索引,但删除NaN。
    gpd.sjoin(districts, shops, how="left", op="contains") \
    .reset_index()\
    .rename(columns={"index": "districts"})\
    .groupby(["districts"])\
    .agg(nshops=("index_right", "nunique"), lshops=("index_right", "unique"))\
    .astype(str)\
    .replace("[nan]", "")
| 区域 | 商店数量 | 商店列表 |
|---|---|---|
| d1 | 2 | ['s1' 's12'] |
| d2 | 2 | ['s12' 's2'] |
| d3 | 0 |
通过这种方式,我们可以知道每个多边形是否有任何匹配点