看起来最初的方法有点令人困惑。
虽然您可以通过
mpatch.Rectangle绘制矩形,但我认为还是通过
FancyArrowPatch绘制矩形更容易。这使它们的行为和缩放类似,这对于设置宽度很有趣。同样,垂直线也使用
FancyArrowPatch绘制。
对于定位,
似乎只需给出
(tail_x, tail_y)和
head_x, head_y。可以通过
arrowstyle=设置视觉尺寸。从样式中省略
head_length=似乎允许看起来像矩形的箭头。对于着色,有
facecolor=和
edgecolor=。还有
color=,它同时处理
facecolor和
edgecolor。
arrow1.set_clip_on(False)允许在边距中绘制箭头。其他函数可以有一个
clip_on=False参数。
zorder=需要使正确的线在另一条线的上方可见。
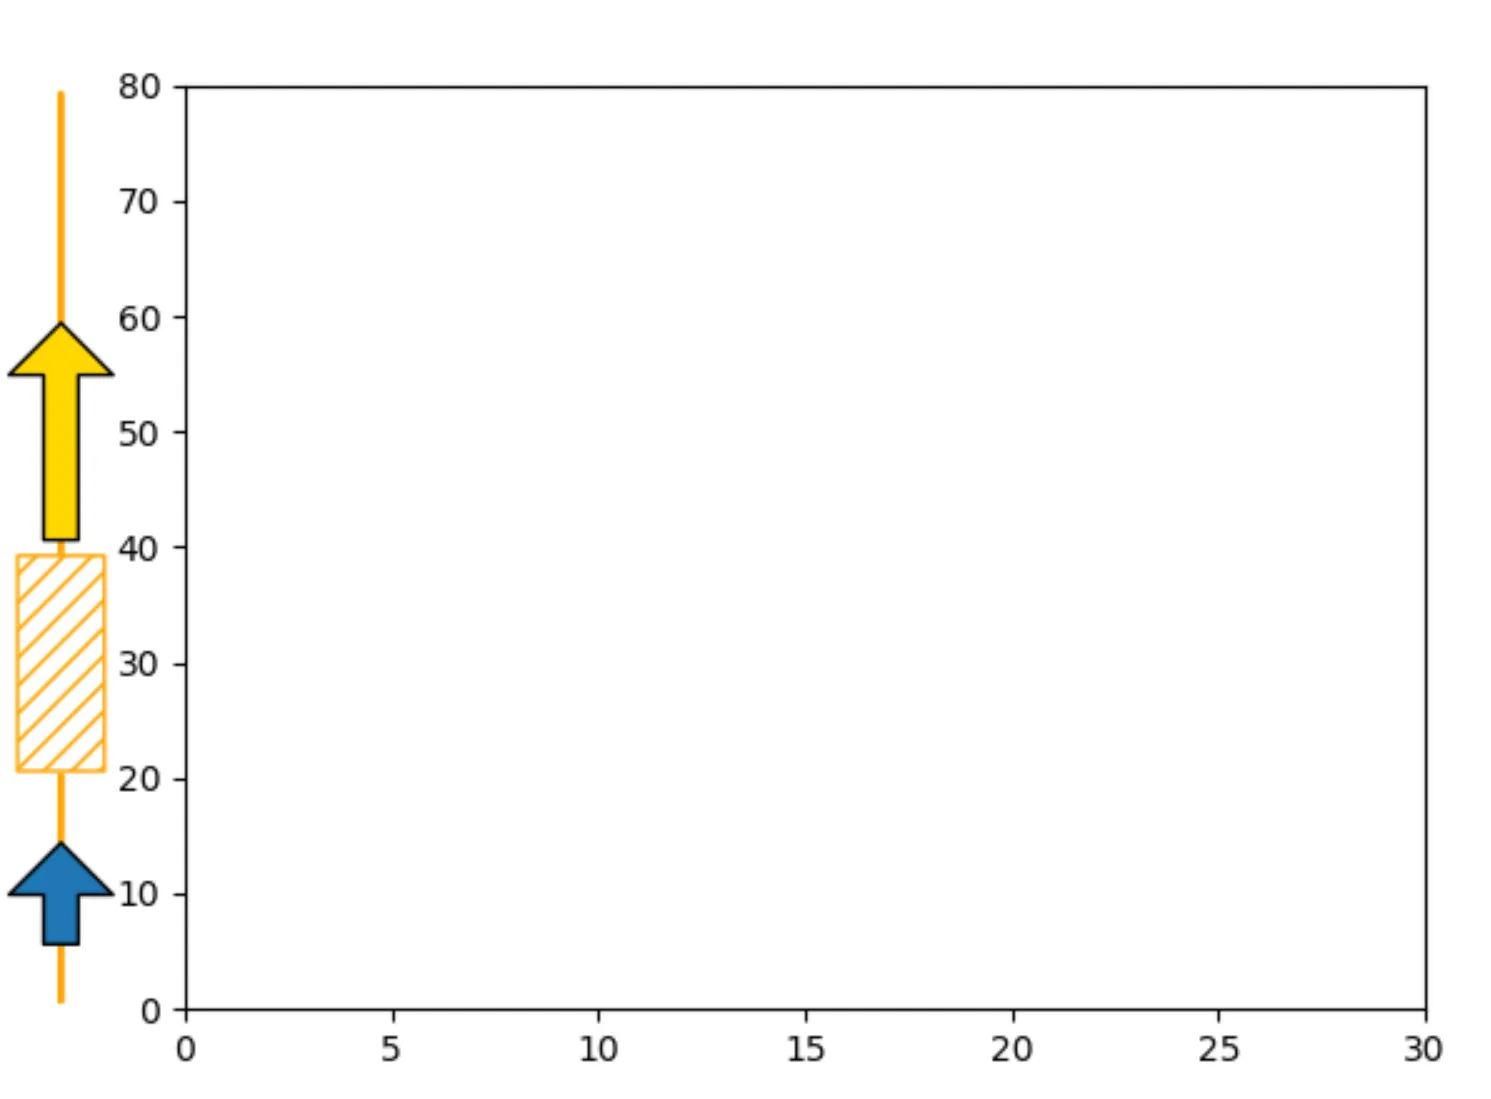
下面是一些示例代码。矩形绘制两次,以便垂直线不会穿过阴影。现在x在
“轴坐标”中定义,y在标准数据坐标中定义。“轴”坐标从0开始,通常y轴绘制的左边框到1,右边框。将x设置为-0.1表示在y轴左侧10%。
import matplotlib.pyplot as plt
import matplotlib.patches as mpatches
import matplotlib.transforms as mtransforms
x0 = -0.1
arrow_style="simple,head_length=15,head_width=30,tail_width=10"
rect_style="simple,tail_width=25"
line_style="simple,tail_width=1"
fig, ax = plt.subplots()
trans = mtransforms.blended_transform_factory(ax.transAxes, ax.transData)
y_tail = 5
y_head = 15
arrow1 = mpatches.FancyArrowPatch((x0, y_tail), (x0, y_head), arrowstyle=arrow_style, transform=trans)
arrow1.set_clip_on(False)
ax.add_patch(arrow1)
y_tail = 40
y_head = 60
arrow2 = mpatches.FancyArrowPatch((x0, y_tail), (x0, y_head), arrowstyle=arrow_style, facecolor='gold', edgecolor='black', linewidth=1, transform=trans)
arrow2.set_clip_on(False)
ax.add_patch(arrow2)
y_tail = 20
y_head = 40
rect_backgr = mpatches.FancyArrowPatch((x0, y_tail), (x0, y_head), arrowstyle=rect_style, color='white', zorder=0, transform=trans)
rect_backgr.set_clip_on(False)
rect = mpatches.FancyArrowPatch((x0, y_tail), (x0, y_head), arrowstyle=rect_style, fill=False, color='orange', hatch='///', transform=trans)
rect.set_clip_on(False)
ax.add_patch(rect_backgr)
ax.add_patch(rect)
line = mpatches.FancyArrowPatch((x0, 0), (x0, 80), arrowstyle=line_style, color='orange', transform=trans, zorder=-1)
line.set_clip_on(False)
ax.add_patch(line)
ax.set_xlim(0, 30)
ax.set_ylim(0, 80)
plt.show()