R的raster包如何将一张图片分割成多个部分?

7
我有一张如下的图片。它的大小为2579*2388像素。假设它的左下角坐标为0,0。我想从这张图片中创建多张100*100像素大小的子图,并将它们保存在工作文件夹中。每个子图将按其左下角坐标命名并保存。
  1. 第一张子图的左下角位于0,0。右上角位于100,100,将以0-0.jpg的名称保存。
  2. 第二张子图的左下角位于10,0。右上角位于110,100,将以10-0.jpg的名称保存。
  3. 完成底部行之后,Y坐标将向上移动10。对于第二行,第一个子图将位于0,10,并将以0-10.jpg的名称保存。
什么是最快的方法来完成此操作?是否有R软件包可以进行快速处理?
我知道对于当前的图片,它将分割成大约257 * 238个图像。但我有足够的磁盘空间,而且我需要每个子图执行文本检测。

raster 包专门用于 "地理数据分析和建模"。 - user3710546
你有什么其他的包推荐吗? - user2543622
6个回答

21

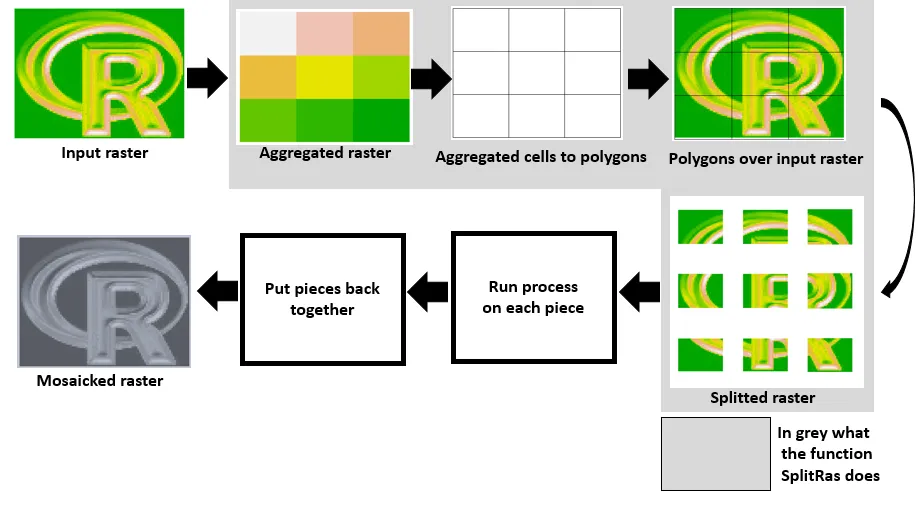
这里是使用“raster”包的另一种方法。该函数将栅格空间聚合为要切割的大小,聚合后的栅格单元被转换为多边形,然后使用每个多边形的范围来裁剪输入栅格。

我相信有更复杂和紧凑的方法来做到这一点,但这种方法对我很有效,而且我也觉得很直观。希望您也会发现它有用。请注意,下面的第4和第5部分仅用于测试,不是函数的一部分。
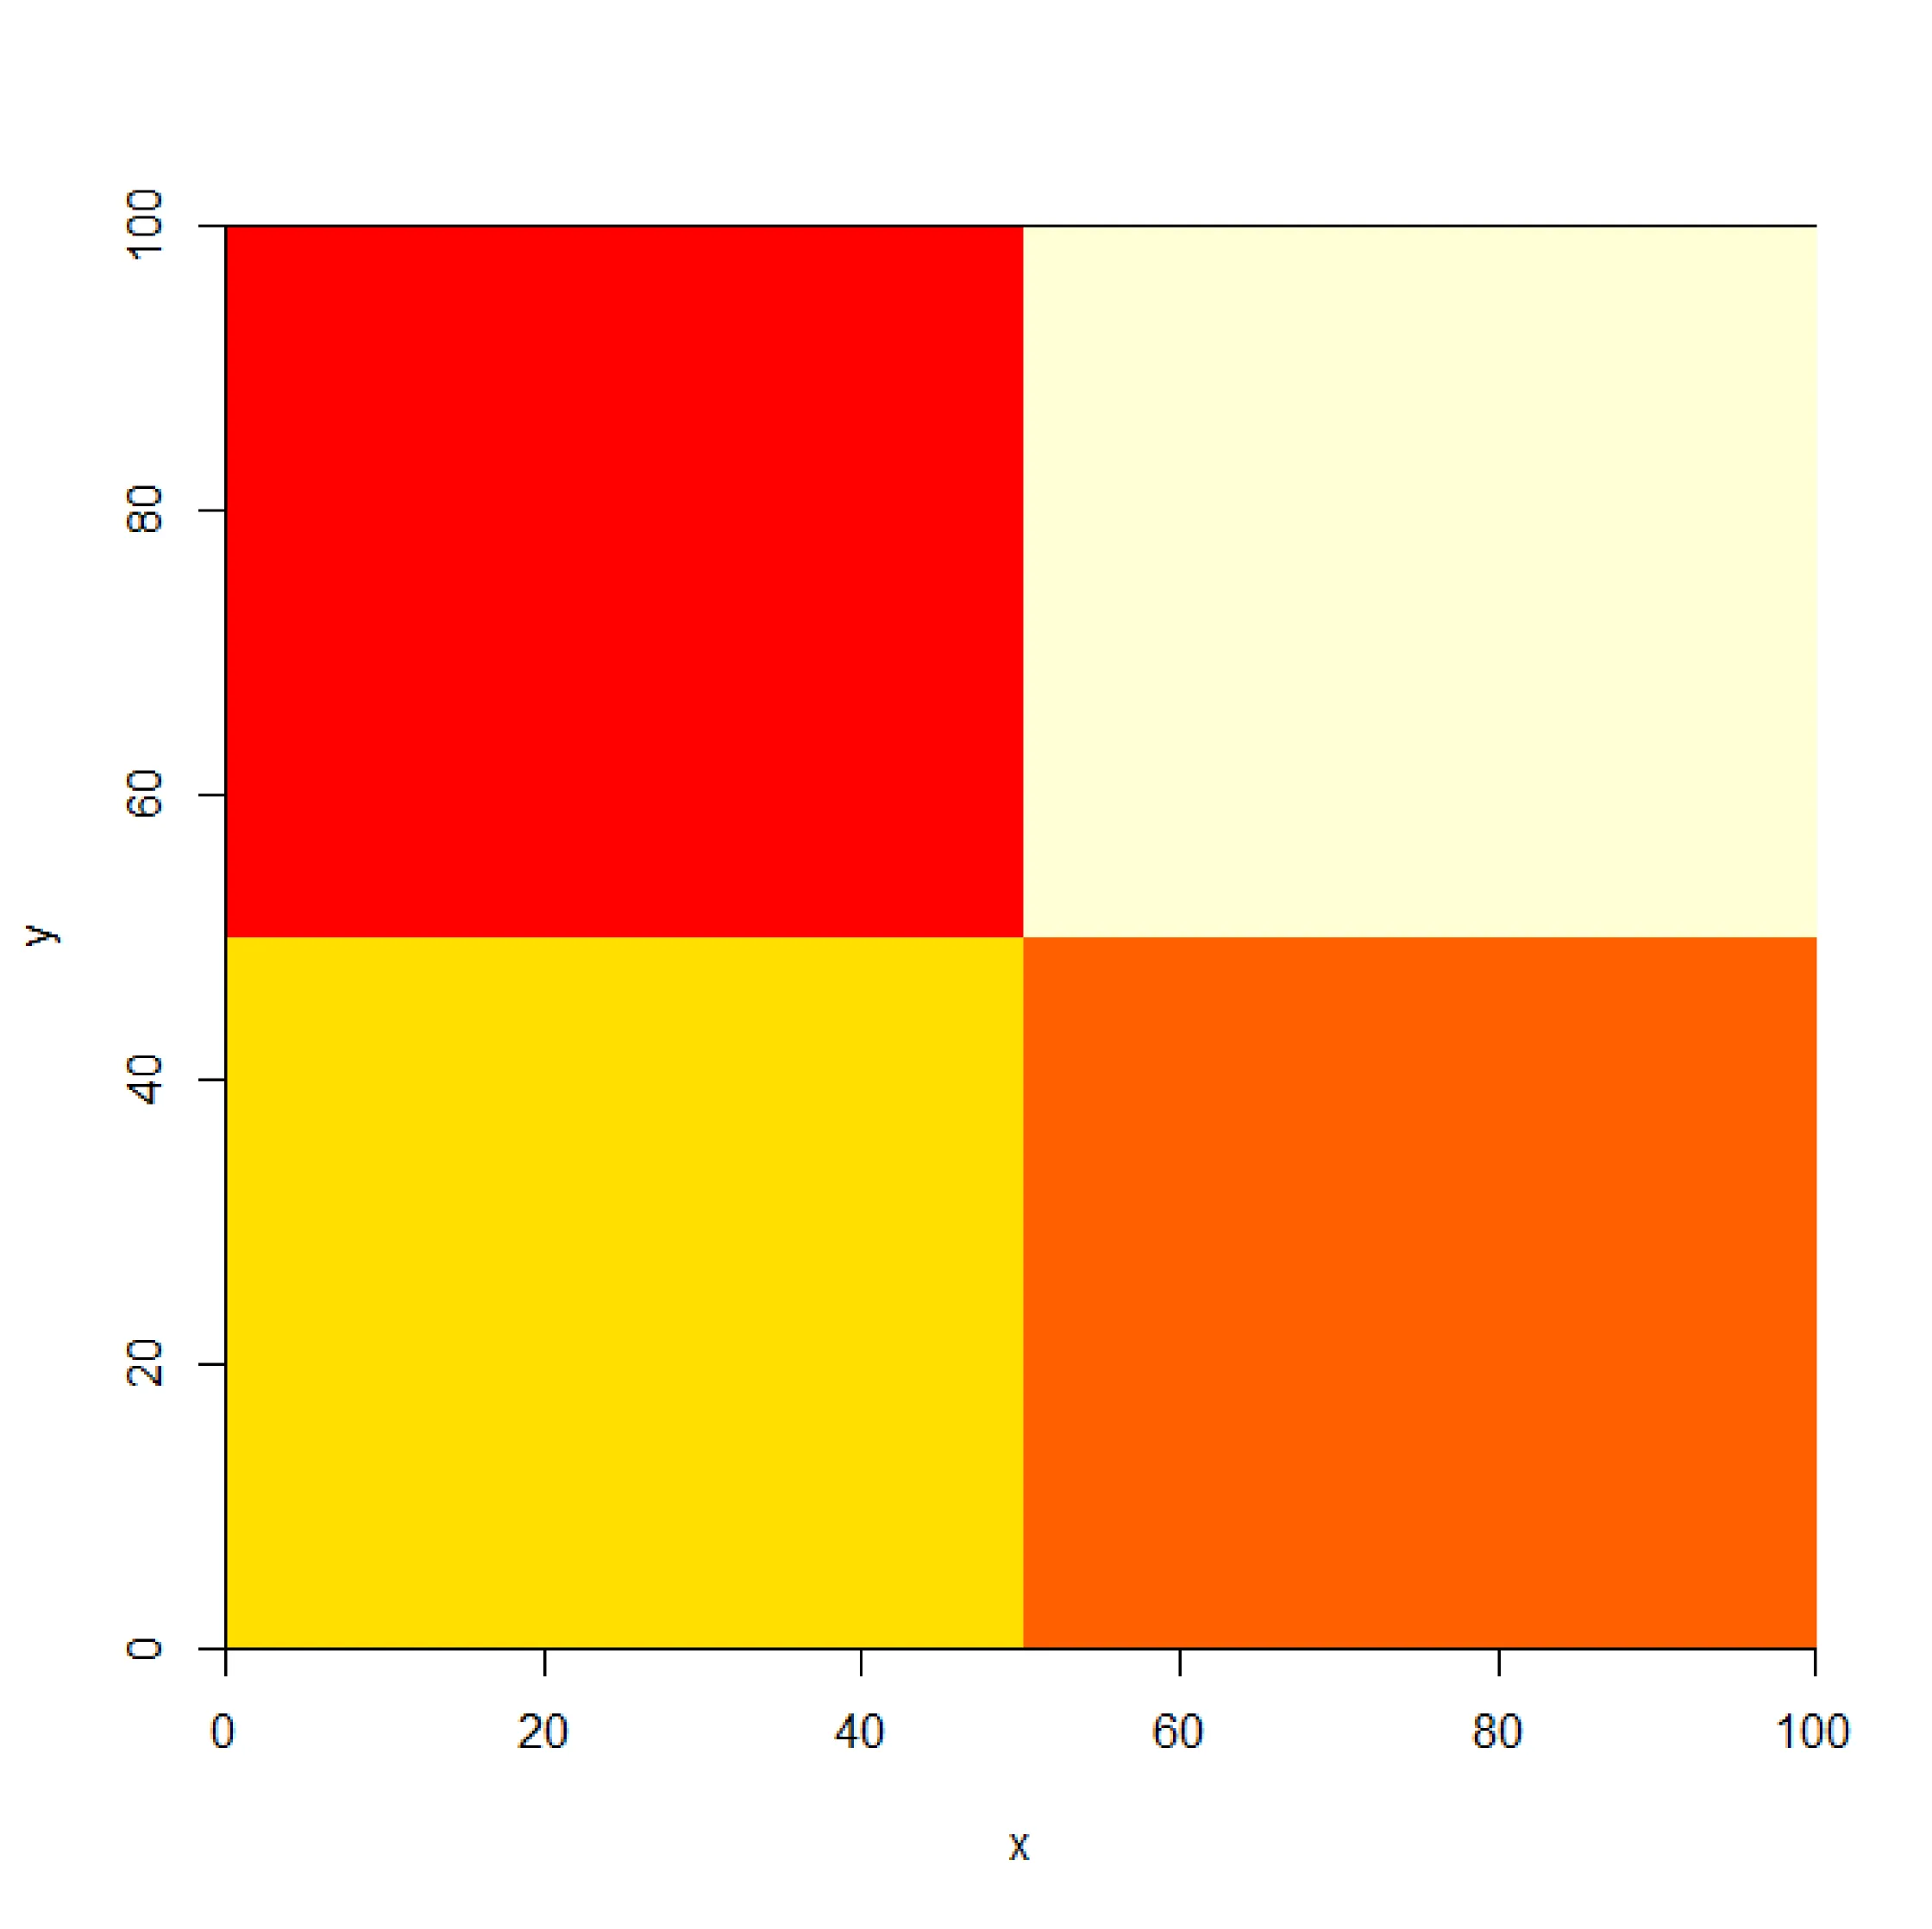
enter image description here

第一部分:加载并绘制示例栅格数据

logo <- raster(system.file("external/rlogo.grd", package="raster"))
plot(logo,axes=F,legend=F,bty="n",box=FALSE)

第二部分:函数本身:

# The function spatially aggregates the original raster
# it turns each aggregated cell into a polygon
# then the extent of each polygon is used to crop
# the original raster.
# The function returns a list with all the pieces
# in case you want to keep them in the memory. 
# it saves and plots each piece
# The arguments are:
# raster = raster to be chopped            (raster object)
# ppside = pieces per side                 (integer)
# save   = write raster                    (TRUE or FALSE)
# plot   = do you want to plot the output? (TRUE or FALSE)
SplitRas <- function(raster,ppside,save,plot){
  h        <- ceiling(ncol(raster)/ppside)
  v        <- ceiling(nrow(raster)/ppside)
  agg      <- aggregate(raster,fact=c(h,v))
  agg[]    <- 1:ncell(agg)
  agg_poly <- rasterToPolygons(agg)
  names(agg_poly) <- "polis"
  r_list <- list()
  for(i in 1:ncell(agg)){
    e1          <- extent(agg_poly[agg_poly$polis==i,])
    r_list[[i]] <- crop(raster,e1)
  }
  if(save==T){
    for(i in 1:length(r_list)){
      writeRaster(r_list[[i]],filename=paste("SplitRas",i,sep=""),
                  format="GTiff",datatype="FLT4S",overwrite=TRUE)  
    }
  }
  if(plot==T){
    par(mfrow=c(ppside,ppside))
    for(i in 1:length(r_list)){
      plot(r_list[[i]],axes=F,legend=F,bty="n",box=FALSE)  
    }
  }
  return(r_list)
}

第三部分:测试函数

SplitRas(raster=logo,ppside=3,save=TRUE,plot=TRUE)
# in this example we chopped the raster in 3 pieces per side
# so 9 pieces in total
# now the raster pieces should be ready 
# to be processed in the default directory
# A feature I like about this function is that it plots
# the pieces in the original order. 

第四部分:对每个部分运行代码并将它们保存回目录中。
# notice if you cropped a rasterbrick 
# use "brick" instead of "raster" to read
# the piece back in R
list2 <- list()
for(i in 1:9){ # change this 9 depending on your number of pieces
  rx <- raster(paste("SplitRas",i,".tif",sep=""))
  # piece_processed <- HERE YOU RUN YOUR CODE
  writeRaster(piece_processed,filename=paste("SplitRas",i,sep=""),
              format="GTiff",datatype="FLT4S",overwrite=TRUE)
}
# once a code has been ran on those pieces
# we save them back in the directory 
# with the same name for convenience

第五部分:让我们把碎片拼回一起。
# read each piece back in R
list2 <- list()
for(i in 1:9){ # change this 9 depending on your number of pieces
  rx <- raster(paste("SplitRas",i,".tif",sep=""))
  list2[[i]] <- rx
}
# mosaic them, plot mosaic & save output
list2$fun   <- max
rast.mosaic <- do.call(mosaic,list2)
plot(rast.mosaic,axes=F,legend=F,bty="n",box=FALSE)
writeRaster(rast.mosaic,filename=paste("Mosaicked_ras",sep=""),
            format="GTiff",datatype="FLT4S",overwrite=TRUE)

一个非常优雅的解决方案。我想要相同的效果,但是我正在使用一个包含9个栅格图层的栅格堆栈。您会在代码中做出哪些修改以保持这些图层的堆叠? - Jecogeo
抱歉Jecogeo,我不确定我理解你的问题。如果参数raster是由一个rasterstack填充的,则输出部分也会作为rastack保留下来。你是否使用了brick来读取输入的rasterstack? - Shepherd
是的,谢谢@Shepherd。正如你所说,当作为rasterstack加载时,输出块被维护为rasteracks。太棒了! - Jecogeo
这个答案被低估了!! - FrsLry

5

以下是一种做法,使用gdalUtils通过GDAL实现,并在需要时进行并行化。

library(gdalUtils)

# Get the dimensions of the jpg    
dims <- as.numeric(
  strsplit(gsub('Size is|\\s+', '', grep('Size is', gdalinfo('R1fqE.jpg'), value=TRUE)), 
           ',')[[1]]
)

# Set the window increment, width and height
incr <- 10
win_width <- 100
win_height <- 100

# Create a data.frame containing coordinates of the lower-left
#  corners of the windows, and the corresponding output filenames.
xy <- setNames(expand.grid(seq(0, dims[1], incr), seq(dims[2], 0, -incr)), 
               c('llx', 'lly'))
xy$nm <- paste0(xy$llx, '-', dims[2] - xy$lly, '.png')

# Create a function to split the raster using gdalUtils::gdal_translate
split_rast <- function(infile, outfile, llx, lly, win_width, win_height) {
  library(gdalUtils)
  gdal_translate(infile, outfile, 
                 srcwin=c(llx, lly - win_height, win_width, win_height))
}

将该函数应用于单个窗口的示例:

split_rast('R1fqE.jpg', xy$nm[1], xy$llx[1], xy$lly[1], 100, 100)

将其应用于前10个窗口的示例:

mapply(split_rast, 'R1fqE.jpg', xy$nm[1:10], xy$llx[1:10], xy$lly[1:10], 100, 100)

使用parLapply进行并行运行的示例:
library(parallel)
cl <- makeCluster(4) # e.g. use 4 cores
clusterExport(cl, c('split_rast', 'xy')) 

system.time({
  parLapply(cl, seq_len(nrow(xy)), function(i) {
    split_rast('R1fqE.jpg', xy$nm[i], xy$llx[i], xy$lly[i], 100, 100)  
  })
})
stopCluster(cl)

3
这可能有点晚了,但对于其他遇到这个问题的人可能会有用。 SpaDES 软件包有一个很方便的函数,叫做splitRaster(),可以实现你想要的功能。
举个例子:
library(raster)
library(SpaDES)

# Create grid
the_grid=raster(xmn=0, xmx=100, ymn=0, ymx=100, resolution=1)

# Set some values
the_grid[0:50,0:50] <- 1
the_grid[51:100,51:100] <- 2
the_grid[51:100,0:50] <- 3
the_grid[0:50,51:100] <- 4

这样做会给你这样的结果: enter image description here 现在使用 SpaDES 包来拆分。根据您希望沿着 x 和 y 轴有多少个瓦片设置 nxny - 如果我们想要 4 个瓦片,则将它们设置为 nx=2ny=2。如果不设置 path,则应将文件写入您当前的目录。还可以提供其他功能,如缓冲区 - 参见 ?splitRaster:
# Split into sections - saves automatically to path
sections=splitRaster(the_grid, nx=2, ny=2, path="/your_output_path/")

变量sections是一个包含the_grid每个部分的栅格列表-可以通过以下方式访问它们:
split_1=sections[[1]]

如果您想要特别保存它们,请使用 writeRaster()

如果要再次创建合并的栅格,请使用 mergeRaster()


这看起来很棒。不幸的是,我将我的150MB光栅图分成了30个部分,最终得到了35GB的数据... - TWest
@TWest 这不是一个 R 的解决方案,但你可以看一下这里的问答 - 它应该能更好地处理内存(尽管我没有测试过):https://gis.stackexchange.com/questions/14712/splitting-raster-into-smaller-chunks-using-gdal - ChrisWills

1

在没有找到仅使用的直接实现时,我使用了以下方法,使用操作,这可能对其他人有所帮助。它生成范围并将原始光栅裁剪到它们。希望这可以帮到你!

## create dummy raster
n <- 50
r <- raster(ncol=n, nrow=n, xmn=4, xmx=10, ymn=52, ymx=54)
projection(r) <- "+proj=longlat +datum=WGS84 +ellps=WGS84 +towgs84=0,0,0"
values(r)     <- 1:n^2+rnorm(n^2)


n.side <-  2  # number of tiles per side
dx     <- (extent(r)[2]- extent(r)[1])/ n.side  # extent of one tile in x direction
dy     <- (extent(r)[4]- extent(r)[3])/ n.side  # extent of one tile in y direction
xs     <- seq(extent(r)[1], by= dx, length= n.side) #lower left x-coordinates
ys     <- seq(extent(r)[3], by= dy, length= n.side) #lower left y-coordinates
cS     <- expand.grid(x= xs, y= ys)

## loop over extents and crop
for(i in 1:nrow(cS)) {
  ex1 <- c(cS[i,1], cS[i,1]+dx, cS[i,2], cS[i,2]+dy)  # create extents for cropping raster
  cl1 <- crop(r, ex1) # crop raster by extent
  writeRaster(x = cl1, filename=paste("test",i,".tif", sep=""), format="GTiff", overwrite=T) # write to file
}

## check functionality...
test <- raster(paste("test1.tif", sep=""))
plot(test)

1
你可以使用gdal和r,如链接所示。
然后,您需要修改第23行以进行适当的偏移,以允许生成的瓦片之间重叠。

它似乎很令人困惑。此外,我不确定它是否说明了如何保存这些图像...是否有可能提供简单的示例或工作代码? - user2543622

0

我认为你需要创建一个处理部分的函数(我们称之为“fnc”)和一个列出你制作的瓷砖数量的表格(我们称之为“tile.tbl”),并且假设你的地理大数据称为“obj”。

    obj=GDALinfo("/pathtodata.tif")
    tile.tbl <- getSpatialTiles(obj, block.x= your size of interest, return.SpatialPolygons=FALSE)        

然后使用snowfall包将其并行化。以下是一个示例:

    library(snowfall)
    sfInit(parallel=TRUE, cpus=parallel::detectCores())
    sfExport("tile.tbl", "fnc")
    sfLibrary(rgdal)
    sfLibrary(raster)
    out.lst <- sfClusterApplyLB(1:nrow(tile.tbl), function(x){ fnc(x, tile.tbl) })
    sfStop()

更详细的说明请点击这里


网页内容由stack overflow 提供, 点击上面的
可以查看英文原文,
原文链接