d3.js扩展饼图标签

4
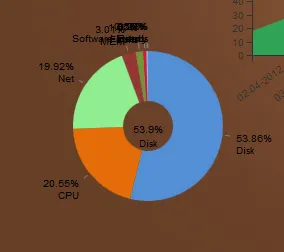
我正在使用d3.js - 我这里有一个饼图。问题是,当切片很小的时候,标签会重叠。如何最好地分散标签呢?
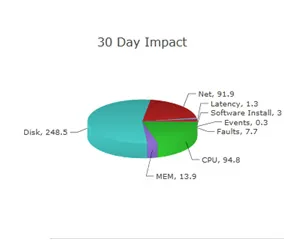
以下是标签的代码。我很好奇 - 是否可以使用d3模拟一个3D饼图?
重叠的标签
一个3D饼图
http://jsfiddle.net/BxLHd/16/
                        //draw labels                       
                        valueLabels = label_group.selectAll("text.value").data(filteredData)
                        valueLabels.enter().append("svg:text")
                                .attr("class", "value")
                                .attr("transform", function(d) {
                                    return "translate(" + Math.cos(((d.startAngle+d.endAngle - Math.PI)/2)) * (that.r + that.textOffset) + "," + Math.sin((d.startAngle+d.endAngle - Math.PI)/2) * (that.r + that.textOffset) + ")";
                                })
                                .attr("dy", function(d){
                                        if ((d.startAngle+d.endAngle)/2 > Math.PI/2 && (d.startAngle+d.endAngle)/2 < Math.PI*1.5 ) {
                                                return 5;
                                        } else {
                                                return -7;
                                        }
                                })
                                .attr("text-anchor", function(d){
                                        if ( (d.startAngle+d.endAngle)/2 < Math.PI ){
                                                return "beginning";
                                        } else {
                                                return "end";
                                        }
                                }).text(function(d){
                                        //if value is greater than threshold show percentage
                                        if(d.value > threshold){
                                            var percentage = (d.value/that.totalOctets)*100;
                                            return percentage.toFixed(2)+"%";
                                        }
                                });

                        valueLabels.transition().duration(this.tweenDuration).attrTween("transform", this.textTween);
                        valueLabels.exit().remove();

类似于您在这里制作的标记图表Lars - http://jsfiddle.net/Qh9X5/1234/ - 我添加了更多数据以显示类似的问题。 - The Old County
在“3D饼图”问题上:为了得到正确的阴影和其他所有东西,需要进行大量额外的工作,而且所有这些都是为了一个非常难以阅读的图形。我不建议这样做! - AmeliaBR
顺便说一下,我鼓励你阅读这篇有关创建简化工作示例的帮助页面文章。在你的fiddle中有很多与标签位置无关的东西,这会让其他人难以使用并感到困惑。 - AmeliaBR
3个回答

6

正如@The Old County发现的那样,我之前发布的答案在Firefox中失败,因为它依赖于SVG方法.getIntersectionList()来查找冲突,而该方法在Firefox中尚未实现

这意味着我们必须跟踪标签位置并自行测试冲突。使用d3,检查布局冲突的最有效方法涉及使用四叉树数据结构存储位置,这样您就不必检查每个标签是否重叠,只需检查可视化区域内的标签。

先前答案的第二部分被替换为:

        /* check whether the default position 
           overlaps any other labels*/
        var conflicts = [];
        labelLayout.visit(function(node, x1, y1, x2, y2){
            //recurse down the tree, adding any overlapping labels
            //to the conflicts array

            //node is the node in the quadtree, 
            //node.point is the value that we added to the tree
            //x1,y1,x2,y2 are the bounds of the rectangle that
            //this node covers

            if (  (x1 > d.r + maxLabelWidth/2) 
                    //left edge of node is to the right of right edge of label
                ||(x2 < d.l - maxLabelWidth/2) 
                    //right edge of node is to the left of left edge of label
                ||(y1 > d.b + maxLabelHeight/2)
                    //top (minY) edge of node is greater than the bottom of label
                ||(y2 < d.t - maxLabelHeight/2 ) )
                    //bottom (maxY) edge of node is less than the top of label

                  return true; //don't bother visiting children or checking this node

            var p = node.point;
            var v = false, h = false;
            if ( p ) { //p is defined, i.e., there is a value stored in this node
                h =  ( ((p.l > d.l) && (p.l <= d.r))
                   || ((p.r > d.l) && (p.r <= d.r)) 
                   || ((p.l < d.l)&&(p.r >=d.r) ) ); //horizontal conflict

                v =  ( ((p.t > d.t) && (p.t <= d.b))
                   || ((p.b > d.t) && (p.b <= d.b))  
                   || ((p.t < d.t)&&(p.b >=d.b) ) ); //vertical conflict

                if (h&&v)
                    conflicts.push(p); //add to conflict list
            }

        });

        if (conflicts.length) {
            console.log(d, " conflicts with ", conflicts);  
            var rightEdge = d3.max(conflicts, function(d2) {
                return d2.r;
            });

            d.l = rightEdge;
            d.x = d.l + bbox.width / 2 + 5;
            d.r = d.l + bbox.width + 10;
        }
        else console.log("no conflicts for ", d);

        /* add this label to the quadtree, so it will show up as a conflict
           for future labels.  */
        labelLayout.add( d );
        var maxLabelWidth = Math.max(maxLabelWidth, bbox.width+10);
        var maxLabelHeight = Math.max(maxLabelHeight, bbox.height+10);

请注意,我已经将标签边缘的参数名称更改为l/r/b/t(左/右/底部/顶部),以便在我的脑海中保持逻辑。
这里有一个实时演示:http://jsfiddle.net/Qh9X5/1249/ 这种方法的另一个好处是,在实际设置位置之前,您可以根据标签的最终位置检查冲突。 这意味着,在确定所有标签的位置后,您可以使用过渡将标签移动到位置。

2
应该是可以做到的。您要如何处理标签间的间距取决于您想要做什么。然而,没有内置的方法来实现这一点。
标签的主要问题在于,在您的示例中,它们依赖于用于定位饼图切片的相同数据。如果您希望它们更像Excel一样分散(即给它们空间),则需要有创意。您拥有的信息是它们的起始位置、高度和宽度。
解决此问题的一个非常有趣的(我定义的有趣)方法是创建一个随机求解器,以获得标签的最佳排列。您可以使用基于能量的方法来完成此操作。定义一个能量函数,其中能量基于两个标准增加:与起始点的距离和与附近标签的重叠。您可以根据该能量标准进行简单的梯度下降,以找到关于您的总能量的局部最优解,这将导致您的标签尽可能接近其原始点,而不会显着重叠,并且不会使更多的点远离其原始点。
可容忍多少重叠取决于您指定的能量函数,该函数应可调整以获得好看的点分布。同样,您愿意在点的接近程度上妥协多少取决于距离原始点的能量增加函数的形状。(线性能量增加会导致更接近的点,但更大的异常值。二次或三次将具有更大的平均距离,但较小的异常值。)
可能还有一种解决最小值的分析方法,但那将更困难。您可以为定位开发一种启发式方法,这可能就是Excel所做的,但那将不太有趣。

1
这是非常技术性的。你有一个基本的例子可以跟随当前jfiddle代码解决标签间距问题吗?或者一个静态饼图制作?我看过这个例子 - 它通常放置标签 - 但如果它们似乎重叠,则将它们移开 - http://jsfiddle.net/JTuej/9/ - The Old County
@TheOldCounty:真希望你以前能找到那个例子!它看起来和我的非常相似。 - AmeliaBR
我只是碰巧找到了它。我认为这是Lars写的。虽然仍然存在重叠。 - The Old County

0
一种检查冲突的方法是使用<svg>元素的getIntersectionList()方法。该方法要求您传递一个SVGRect对象(与<rect>元素不同!),例如图形元素.getBBox()方法返回的对象。

通过这两种方法,您可以确定标签在屏幕中的位置以及它是否与其他内容重叠。但是,一个复杂之处在于传递给getIntersectionList的矩形坐标被解释为根SVG坐标系内的坐标,而getBBox返回的坐标则是在本地坐标系中的。因此,您还需要使用getCTM()(获取累积变换矩阵)方法在两者之间进行转换。

我从@TheOldCounty在评论中发布的Lars Khottof的示例开始,因为它已经包括了弧线段和标签之间的线条。我进行了一些重新组织,将标签、线条和弧线段放在单独的<g>元素中。这避免了更新时出现奇怪的重叠(弧线段绘制在指针线上方),并且通过将父级<g>元素作为第二个参数传递给getIntersectionList,也很容易定义我们关心的重叠的哪些元素——仅限于其他标签,而不是指针线或弧线段。

标签使用each函数逐个定位,并且必须在计算位置时实际定位(即将属性设置为其最终值,没有过渡效果),以便在下一个标签的默认位置调用getIntersectionList时它们已经就位。

如果标签重叠,移动标签的位置是一个复杂的决定,正如@ckersch的答案所概述的那样。我会简单地将其移动到所有重叠元素的右侧。这可能会在饼图的顶部引起问题,因为最后几个段的标签可能会被移动,以至于它们与第一段的标签重叠,但如果饼图按段大小排序,则这不太可能发生。

以下是关键代码:

    labels.text(function (d) {
        // Set the text *first*, so we can query the size
        // of the label with .getBBox()
        return d.value;
    })
    .each(function (d, i) {
        // Move all calculations into the each function.
        // Position values are stored in the data object 
        // so can be accessed later when drawing the line

        /* calculate the position of the center marker */
        var a = (d.startAngle + d.endAngle) / 2 ;

        //trig functions adjusted to use the angle relative
        //to the "12 o'clock" vector:
        d.cx = Math.sin(a) * (that.radius - 75);
        d.cy = -Math.cos(a) * (that.radius - 75);

        /* calculate the default position for the label,
           so that the middle of the label is centered in the arc*/
        var bbox = this.getBBox();
        //bbox.width and bbox.height will 
        //describe the size of the label text
        var labelRadius = that.radius - 20;
        d.x =  Math.sin(a) * (labelRadius);
        d.sx = d.x - bbox.width / 2 - 2;
        d.ox = d.x + bbox.width / 2 + 2;
        d.y = -Math.cos(a) * (that.radius - 20);
        d.sy = d.oy = d.y + 5;

        /* check whether the default position 
           overlaps any other labels*/

        //adjust the bbox according to the default position
        //AND the transform in effect
        var matrix = this.getCTM();
        bbox.x = d.x + matrix.e;
        bbox.y = d.y + matrix.f;

        var conflicts = this.ownerSVGElement
                            .getIntersectionList(bbox, this.parentNode);

        /* clear conflicts */
        if (conflicts.length) {
            console.log("Conflict for ", d.data, conflicts);   
            var maxX = d3.max(conflicts, function(node) {
                var bb = node.getBBox();
                return bb.x + bb.width;
            })

            d.x = maxX + 13;
            d.sx = d.x - bbox.width / 2 - 2;
            d.ox = d.x + bbox.width / 2 + 2;

        }

        /* position this label, so it will show up as a conflict
           for future labels. (Unfortunately, you can't use transitions.) */
        d3.select(this)
            .attr("x", function (d) {
                return d.x;
            })
            .attr("y", function (d) {
                return d.y;
            });
    });

这里是可工作的代码片段:http://jsfiddle.net/Qh9X5/1237/


我扩展了这个示例以提供更多数据 - http://jsfiddle.net/JTuej/16/ - The Old County
你使用的是哪个浏览器?它给你什么错误信息?代码第235行是var conflicts = this.ownerSVGElement.getIntersectionList(bbox, this.parentNode); 这些都是标准接口属性和方法,但有些浏览器可能不会完全支持。 - AmeliaBR
1
它是Firefox 17.0.4 - NS_ERROR_NOT_IMPLEMENTED:组件返回失败代码:0x80004001(NS_ERROR_NOT_IMPLEMENTED)[nsIDOMSVGSVGElement.getIntersectionList] [在此错误中断].getIntersectionList(bbox,this.parentNode); - The Old County
唉,是的。看起来Firefox还没有实现.getIntersectionList()和相关方法:MDN文章Bugzilla页面。你必须自己跟踪所有标签位置并检查冲突。 - AmeliaBR

网页内容由stack overflow 提供, 点击上面的
可以查看英文原文,
原文链接