我觉得这对于 ggplot、tidyverse 和 lubridate 来说应该是一项简单的任务,但我似乎找不到一个优雅的解决方案。
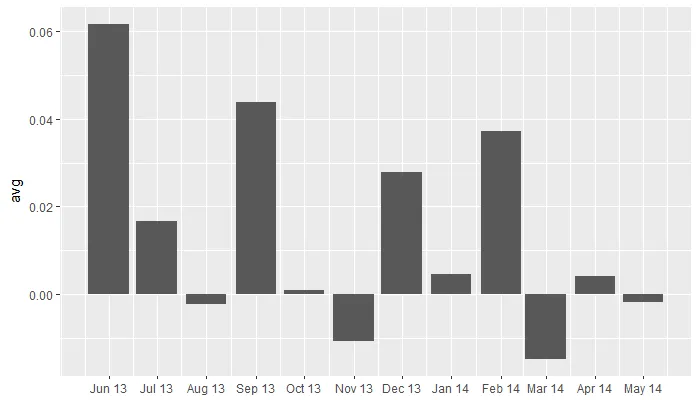
目标:创建一个按年和月聚合/汇总/分组的数据条形图。
#Libraries
library(tidyverse)
library(lubridate)

# Data
date <- sample(seq(as_date('2013-06-01'), as_date('2014-5-31'), by="day"), 10000, replace = TRUE)
value <- rnorm(10000)
df <- tibble(date, value)

# Summarise
df2 <- df %>%
  mutate(year = year(date), month = month(date)) %>%
  unite(year_month,year,month) %>%
  group_by(year_month) %>%
  summarise(avg = mean(value),
            cnt = n())
# Plot
ggplot(df2) +
  geom_bar(aes(x=year_month, y = avg), stat = 'identity')
当我创建year_month变量时,它自然成为字符变量而不是日期变量。 我还尝试了按year(date),month(date)分组,但然后我无法弄清如何在ggplot中使用两个变量作为x轴。也许通过将日期调整为每月的第一天来解决这个问题...?
breaks = "month"时,scale_x_date 函数的最后一个参数才起作用。 - Luiz Felipe Freitasscale_x_date()中使用limits和expand参数来避免这种情况。请参见https://dev59.com/5mUq5IYBdhLWcg3wJM9A。 - Jeffrey Girard