library(dplyr) #Devel version, soon-to-be-released 0.6.0
library(tidyr)
library(ggplot2)
library(forcats) #for gss_cat data
我正试图编写一个函数,将即将发布的
dplyr开发版本中的quosure与tidyr::gather和ggplot2组合在一起。到目前为止,它似乎可以与tidyr一起使用,但我在绘图方面遇到了问题。下面的函数似乎可以与
tidyr的gather一起使用:GatherFun<-function(gath){
gath<-enquo(gath)
gss_cat%>%select(relig,marital,race,partyid)%>%
gather(key,value,-!!gath)%>%
count(!!gath,key,value)%>%
mutate(perc=n/sum(n))
}
但我不知道如何让图表正常工作。我尝试使用 ggplot2 的 !!gath,但没有成功。
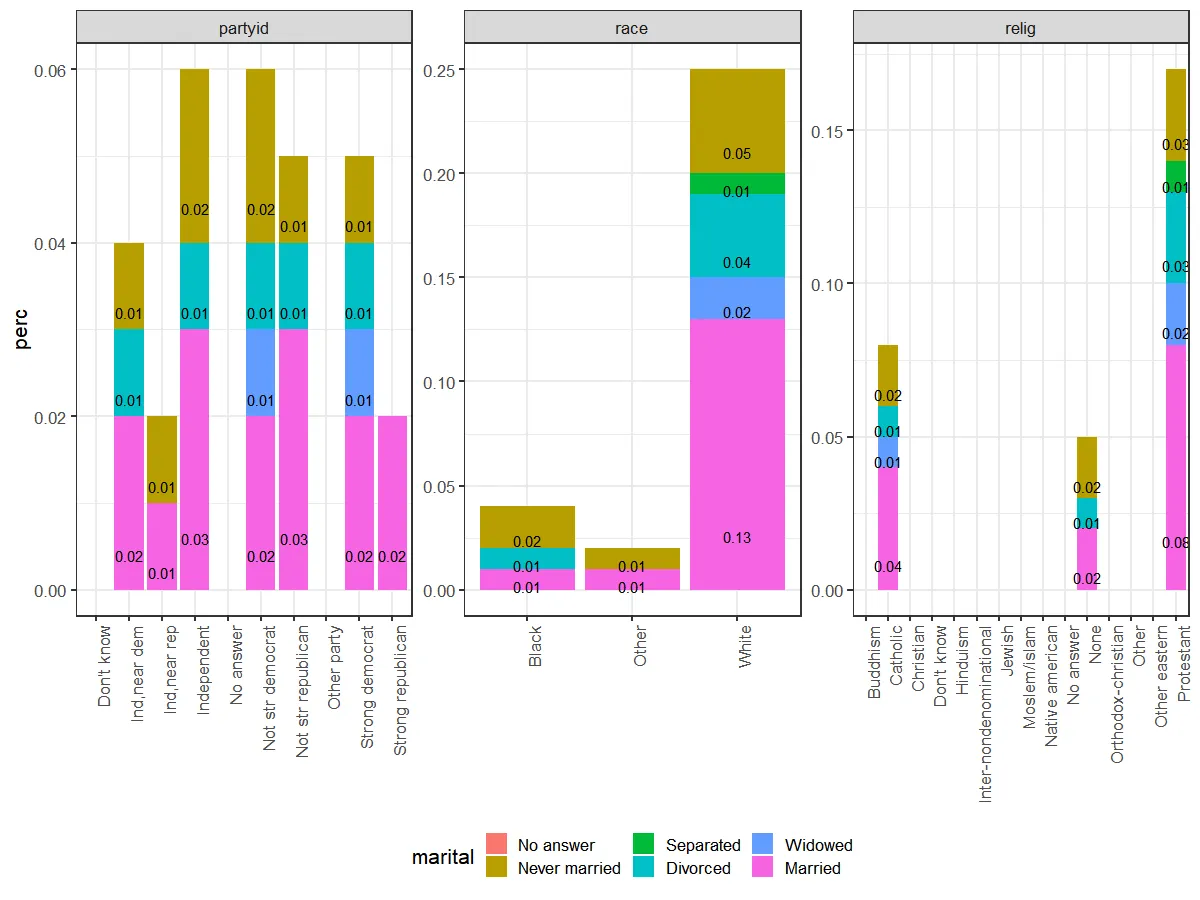
GatherFun<-function(gath){
  gath<-enquo(gath)

  gss_cat%>%select(relig,marital,race,partyid)%>%
    gather(key,value,-!!gath)%>%
    count(!!gath,key,value)%>%
    mutate(perc=n/sum(n))%>%
    ggplot(aes(x=value,y=perc,fill=!!gath))+
       geom_col()+
       facet_wrap(~key, scales = "free") +
       geom_text(aes(x = "value", y = "perc",
                     label = "perc", group = !!gath),
                 position = position_stack(vjust = .05))
}