我想在我的安卓应用程序中绘制一个饼图。请问您能否建议一种简单的方法来实现这个功能?我已经为此编写了一个视图类,但并不令人满意。因此,如果您能告诉我一个好的、高性能的图表库,我将不胜感激。
7个回答
23
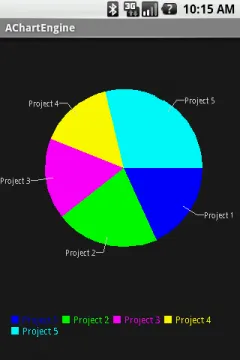
从以下链接下载jar包:
http://www.achartengine.org/content/download.html
将jar包添加到项目lib文件夹中。开发者还提供了一个示例,您可以查看并按需进行修改。
这里也有一个演示:
http://www.achartengine.org/content/demo.html
文档:
http://www.achartengine.org/content/javadoc/org/achartengine/chart/PieChart.html
示例:
<LinearLayout xmlns:android="http://schemas.android.com/apk/res/android"
    android:layout_width="fill_parent"
    android:layout_height="fill_parent"
    android:orientation="vertical" >

    <LinearLayout
        android:id="@+id/chart"
        android:layout_width="fill_parent"
        android:layout_height="wrap_content"
        android:layout_weight="1"
        android:orientation="horizontal" >
    </LinearLayout>

</LinearLayout>
Activity类
public class AChartEnginePieChartActivity extends Activity {

    private static int[] COLORS = new int[] { Color.GREEN, Color.BLUE,Color.MAGENTA, Color.CYAN };

    private static double[] VALUES = new double[] { 10, 11, 12, 13 };

    private static String[] NAME_LIST = new String[] { "A", "B", "C", "D" };

    private CategorySeries mSeries = new CategorySeries("");

    private DefaultRenderer mRenderer = new DefaultRenderer();

    private GraphicalView mChartView;

    @Override
    protected void onCreate(Bundle savedInstanceState) {
        super.onCreate(savedInstanceState);
        setContentView(R.layout.main);

        mRenderer.setApplyBackgroundColor(true);
        mRenderer.setBackgroundColor(Color.argb(100, 50, 50, 50));
        mRenderer.setChartTitleTextSize(20);
        mRenderer.setLabelsTextSize(15);
        mRenderer.setLegendTextSize(15);
        mRenderer.setMargins(new int[] { 20, 30, 15, 0 });
        mRenderer.setZoomButtonsVisible(true);
        mRenderer.setStartAngle(90);

        for (int i = 0; i < VALUES.length; i++) {
            mSeries.add(NAME_LIST[i] + " " + VALUES[i], VALUES[i]);
            SimpleSeriesRenderer renderer = new SimpleSeriesRenderer();
            renderer.setColor(COLORS[(mSeries.getItemCount() - 1) % COLORS.length]);
            mRenderer.addSeriesRenderer(renderer);
        }

        if (mChartView != null) {
            mChartView.repaint();
        }

    }

    @Override
    protected void onResume() {
        super.onResume();
        if (mChartView == null) {
            LinearLayout layout = (LinearLayout) findViewById(R.id.chart);
            mChartView = ChartFactory.getPieChartView(this, mSeries, mRenderer);
            mRenderer.setClickEnabled(true);
            mRenderer.setSelectableBuffer(10);

            mChartView.setOnClickListener(new View.OnClickListener() {
                @Override
                public void onClick(View v) {
                    SeriesSelection seriesSelection = mChartView.getCurrentSeriesAndPoint();

                    if (seriesSelection == null) {
                        Toast.makeText(AChartEnginePieChartActivity.this,"No chart element was clicked",Toast.LENGTH_SHORT).show();
                    }
                    else {
                        Toast.makeText(AChartEnginePieChartActivity.this,"Chart element data point index "+ (seriesSelection.getPointIndex()+1) + " was clicked" + " point value="+ seriesSelection.getValue(), Toast.LENGTH_SHORT).show();
                    }
                }
            });

            mChartView.setOnLongClickListener(new View.OnLongClickListener() {
                @Override
                public boolean onLongClick(View v) {
                    SeriesSelection seriesSelection = mChartView.getCurrentSeriesAndPoint();
                    if (seriesSelection == null) {
                        Toast.makeText(AChartEnginePieChartActivity.this,"No chart element was long pressed", Toast.LENGTH_SHORT);
                        return false;
                    }
                    else {
                        Toast.makeText(AChartEnginePieChartActivity.this,"Chart element data point index "+ seriesSelection.getPointIndex()+ " was long pressed",Toast.LENGTH_SHORT);
                        return true;
                    }
                }
            });
            layout.addView(mChartView, new LayoutParams(LayoutParams.FILL_PARENT, LayoutParams.FILL_PARENT));
        }
        else {
        mChartView.repaint();
        }
    }
}
- Raghunandan
4
@Raghunandan:如何垂直对齐“标签文本”和“图例文本”并使其不可见。 - Kaushik
4如果有人想知道如何将achartengine库作为Gradle的管理依赖项,请在全局
build.gradle文件(位于buildscript和allprojects中)中添加repositories { maven { url "https://repository-achartengine.forge.cloudbees.com/snapshot/" } },然后在您模块的build.gradle文件的依赖项中添加compile 'org.achartengine:achartengine:1.2.0'。请注意不要改变原始意思。 - Blacklight如何禁止移动饼图? - Vasant
我正在按照上面的饼图方法工作。我的问题是它在饼图周围保留间距。你能帮我吗?http://stackoverflow.com/questions/37159890/how-to-remove-extra-spacing-from-piechart - Vasant
18
或者,如果您不想使用第三方库,您可以使用此公式来获取圆上的点,给定半径r:
x = r * Math.cos(2 * Math.PI) //This will give you r
y = r * Math.sin(2 * Math.PI) //This will give you 0
对于圆的其他点,您需要修改余弦函数参数,例如:
x = r * Math.cos(2 * Math.PI / 6) //This will give you r/2
y = r * Math.sin(2 * Math.PI / 6) //This will give you r*sqrt(3/2)
for(int i=0;i<n;i++) {
    x = r * Math.cos(2 * Math.PI * i / n)
    y = r * Math.sin(2 * Math.PI * i / n)
    //Draw PointF(x,y)
}
- nstosic
2
2不错的想法。但是你需要一个自定义视图来绘制圆形,并使用画笔对象来着色圆形的部分。 - Raghunandan
5感谢您的反馈。AChartEngine是一个很棒的库,用于将固定值显示为图表。我回复只是为了用原生SDK说明数学方法。 - nstosic
4
- marshallino16
1
目前这只是一个简单的 POC,但请不要犹豫,欢迎 fork 和 pull request :) - marshallino16
3
如果您想要最好的饼图,请按照以下步骤操作:
1. 打开 build.gradle(Modul: app) ,添加依赖 implementation 'com.github.PhilJay:MPAndroidChart:v3.0.3'
2. 创建您的布局如下:
<?xml version="1.0" encoding="utf-8"?>
 <LinearLayout
 xmlns:android="http://schemas.android.com/apk/res/android"
    xmlns:tools="http://schemas.android.com/tools"
    android:layout_width="match_parent"
    android:layout_height="match_parent"
    xmlns:app="http://schemas.android.com/apk/res-auto"
        android:layout_gravity="center_vertical"
        android:orientation="vertical">

        <com.github.mikephil.charting.charts.PieChart
            android:id="@+id/piechart_1"
            android:layout_width="match_parent"
            android:layout_height="300sp">
        </com.github.mikephil.charting.charts.PieChart>
    </LinearLayout>
Open Your activity file and paste the following codes:
public class YourActivity extends AppCompatActivity{

        protected void onCreate(Bundle saveInstanceState)
{
          super.onCreate(saveInstanceState);
          setContentView(R.layout.Your_layout);
          setPieChart(); }

         public void setPieChart() {
                    this.pieChart = pieChart;
                    pieChart.setUsePercentValues(true);
                    pieChart.getDescription().setEnabled(true);
                    pieChart.setExtraOffsets(5,10,5,5);
                    pieChart.setDragDecelerationFrictionCoef(0.9f);
                    pieChart.setTransparentCircleRadius(61f);
                    pieChart.setHoleColor(Color.WHITE);
                    pieChart.animateY(1000, Easing.EasingOption.EaseInOutCubic);
                    ArrayList<PieEntry> yValues = new ArrayList<>();
                    yValues.add(new PieEntry(34f,"Ilala"));
                    yValues.add(new PieEntry(56f,"Temeke"));
                    yValues.add(new PieEntry(66f,"Kinondoni"));
                    yValues.add(new PieEntry(45f,"Kigamboni"));

                    PieDataSet dataSet = new PieDataSet(yValues, "Desease Per
                     Regions");
                    dataSet.setSliceSpace(3f);
                    dataSet.setSelectionShift(5f);
                    dataSet.setColors(ColorTemplate.COLORFUL_COLORS);
                    PieData pieData = new PieData((dataSet));
                    pieData.setValueTextSize(10f);
                    pieData.setValueTextColor(Color.YELLOW);
                    pieChart.setData(pieData);
                    //PieChart Ends Here
                }
}
它将为您提供下面显示的饼图;
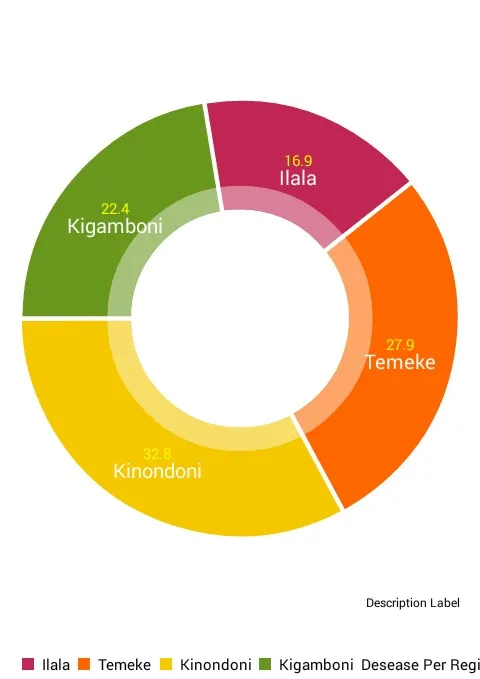
该库还可用于绘制条形图、折线图、水平条形图等。
- eli
3
@BjörnHallström 使用相同的库,但如果图例垂直显示在饼图右侧,则不会显示所有标签。 - Erum
@Erum,您可以更改图例位置。 - eli
@eli 这是怎么成为“最佳饼图”的呢? - Mahozad
2
- Phantômaxx
3
如何禁用移动和缩放。 - Vasant
@Vasant https://dev59.com/PVjUa4cB1Zd3GeqPTrGI - Phantômaxx
如何增加饼图的半径? - Vasant
1
打开 build.gradle (module:app) 文件并在 dependencies 中添加该库。
打开activity_main.xml并添加以下代码以获取Android饼图视图。
implementation 'com.github.lecho:hellocharts-library:1.5.8@aar'
接下来,您需要打开 build.gradle(Project)文件并添加 Jcenter,因为该库可通过 Jcenter 获取。
allprojects {
repositories {
    google()
    jcenter()
}
}
现在点击“立即同步”来同步您的项目。打开activity_main.xml并添加以下代码以获取Android饼图视图。
< ?xml version="1.0" encoding="utf-8"?>
<LinearLayout xmlns:android="http://schemas.android.com/apk/res/android"
xmlns:app="http://schemas.android.com/apk/res-auto"
xmlns:tools="http://schemas.android.com/tools"
android:layout_width="match_parent"
android:layout_height="match_parent"
android:orientation="vertical"
 tools:context="com.codingdemos.codingdemos.MainActivity">
<lecho.lib.hellocharts.view.PieChartView
android:id="@+id/chart"
android:layout_width="match_parent"
android:layout_height="match_parent" />
< /LinearLayout>
这是MainActivity.java文件的代码。
public class MainActivity extends AppCompatActivity {
    PieChartView pieChartView;

@Override
protected void onCreate(Bundle savedInstanceState) {
    super.onCreate(savedInstanceState);
    setContentView(R.layout.activity_main);

    pieChartView = findViewById(R.id.chart);

    List pieData = new ArrayList<>();
    pieData.add(new SliceValue(15, Color.BLUE).setLabel("Q1: $10"));
    pieData.add(new SliceValue(25, Color.GRAY).setLabel("Q2: $4"));
    pieData.add(new SliceValue(10, Color.RED).setLabel("Q3: $18"));
    pieData.add(new SliceValue(60, Color.MAGENTA).setLabel("Q4: $28"));

    PieChartData pieChartData = new PieChartData(pieData);
    pieChartData.setHasLabels(true).setValueLabelTextSize(14);
    pieChartData.setHasCenterCircle(true).setCenterText1("Sales in million").setCenterText1FontSize(20).setCenterText1Color(Color.parseColor("#0097A7"));
    pieChartView.setPieChartData(pieChartData);
}
}
您可以查看https://www.codingdemos.com/android-pie-chart-tutorial/以获取更多描述。
- M Karimi
网页内容由stack overflow 提供, 点击上面的可以查看英文原文,
原文链接
原文链接