你可以通过
putout代码转换器来追踪函数调用。
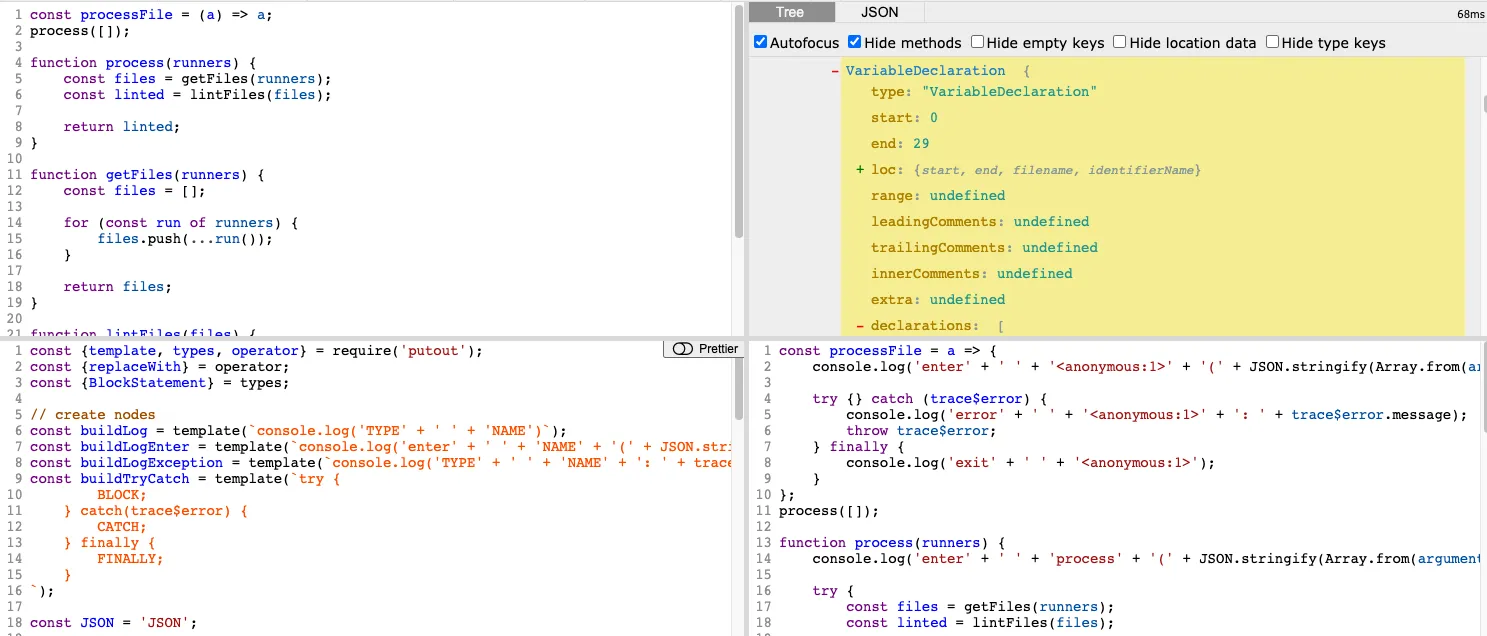
插件将如下所示:
const {template, types, operator} = require('putout');
const {replaceWith} = operator;
const {BlockStatement} = types;
const buildLog = template(`console.log('TYPE' + ' ' + 'NAME')`);
const buildLogEnter = template(`console.log('enter' + ' ' + 'NAME' + '(' + JSON.stringify(Array.from(arguments)) + ')')`);
const buildLogException = template(`console.log('TYPE' + ' ' + 'NAME' + ': ' + trace$error.message); throw trace$error`);
const buildTryCatch = template(`try {
BLOCK;
} catch(trace$error) {
CATCH;
} finally {
FINALLY;
}
`);
const JSON = 'JSON';
module.exports.include = () => [
'Function',
];
module.exports.fix = (path) => {
const name = getName(path);
const enterLog = buildLogEnter({
NAME: name,
JSON,
});
const exitLog = buildLogEvent(name, 'exit');
const errorLog = buildLogExceptionEvent(name);
const bodyPath = path.get('body');
replaceWith(bodyPath, BlockStatement([buildTryCatch({
BLOCK: path.node.body.body,
CATCH: errorLog,
FINALLY: exitLog,
})]));
bodyPath.node.body.unshift(enterLog);
};
function getName(path) {
if (path.isClassMethod())
return path.node.key.name;
if (path.isFunctionDeclaration())
return path.node.id.name;
const {line} = path.node.loc.start;
return `<anonymous:${line}>`;
}
function buildLogEvent(name, type) {
return buildLog({
NAME: name,
TYPE: type,
});
}
function buildLogExceptionEvent(name) {
return buildLogException({
NAME: name,
TYPE: 'error',
});
}
假设这是您想要跟踪的代码:
const processFile = (a) => a;
process([]);

function process(runners) {
    const files = getFiles(runners);
    const linted = lintFiles(files);

    return linted;
}

function getFiles(runners) {
    const files = [];

    for (const run of runners) {
        files.push(...run());
    }

    return files;
}

function lintFiles(files) {
    const linted = [];

    for (const file of files) {
        linted.push(processFile(file));
    }

    return linted;
}
这是一个完整的图片:
如果您将处理过的源代码保存为
trace.js并在Node中运行它,您将会得到:
> node trace.js
enter process([[]])
enter getFiles([[]])
exit getFiles
enter lintFiles([[]])
exit lintFiles
exit process
有与跟踪函数相关的发布问题。
console.trace()而不是在多个地方使用console.log,这样堆栈信息就会出现在开发者工具中。这个解决方案可行吗? - vcsjones