我在Matlab中有一个图表,并通过以下方式将背景设置为透明:
set(gcf, 'Color', 'None');
set(gca, 'Color', 'None');
当我尝试保存图像(从查看器中),我保存为“.png”,但它带有白色背景。我该如何保存它为透明背景?
我在Matlab中有一个图表,并通过以下方式将背景设置为透明:
set(gcf, 'Color', 'None');
set(gca, 'Color', 'None');
saveas和print命令无法很好地处理透明的元素。你需要将其保存为带有一些背景的形式,然后通过imread/imwrite或其他工具进行转换。imwrite(bitmapData, 'a.png', 'png', 'transparency', backgroundColor)。我仍然希望有一个简单的解决方案,不需要安装任何其他软件(公司电脑不允许 :/)。我偶然发现了这个链接,上面写着:
你需要做的只有以下几步:
1)在Matlab文件中添加命令以使用透明背景格式化图像
 set(gcf, 'color', 'none');
 set(gca, 'color', 'none');
并将生成的图形保存或导出为eps格式(例如Bspline.eps)。
2)在NotePad中打开Bspline.eps
3)查看第一行,例如%!PS-Adobe-3.0 EPSF-3.0。最后一个数字3.0表示Postscript级别。对于级别3,搜索字符串rf。您将在一行中找到类似以下内容的四个数字后跟rf:
0 0 3025 2593 rf %使用%注释掉该行。
(对于级别2,请搜索字符串pr而不是rf)
保存文件。
现在您可以使用eps文件,或将其转换为pdf,然后再使用它。无论哪种方式,它都将具有透明背景。
额外信息
对于我来说,这是两行带有re和两行,尽管我在彼此之后立即拥有%!PS-Adobe-3.0 EPSF-3.0。但结果是Figure现在是透明的。
re代码来手动编辑背景透明。如果修复如此简单,而且确实如此,为什么TMW不在生成EPS图像时提供透明背景选项呢? - ofloveandhatec0 1 j 1 sg 0 0 12252 11412 rf 6 w
具备必要的rf。 - ofloveandhate1 GC N 0 0 576 756 re f GR GS [1 0 0 1 18 18] CT 1 GC N 0 0 576 756 re f GR - ofloveandhate自从MATLAB 2014b发布以来,情况已经发生了变化。新实现的图形系统(称为HG2,即Handle Graphics version 2)在透明度方面表现更好。
现在,它至少能正确保存透明度到SVG中!
exportgraphics支持透明背景,但仅适用于矢量输出(不适用于渲染内容)。要导出具有透明度的渲染数据,仍然无法保存透明度。但是,您可以通过使用两种不同的背景颜色(例如白色和黑色)保存渲染数据,并加载两个临时图像,解决简单的方程组,从而检索透明度和原始颜色数据,然后将所有这些保存到RGBA png文件中。% create example data
g = -10:0.1:10;
[x, y, z] = ndgrid(g, g, g);
v = (x.^2 + y.^2 - 10).^2 + (z.^2 - 5).^2;
% render in 3D with transparency
fig = figure();
% one surface fully opaque
fv = isosurface(x, y, z, v, 20);
p = patch(fv, 'FaceColor', [1, 0, 0], 'FaceAlpha', 1, 'EdgeColor', 'none');
% another surface with transparency
fv = isosurface(x, y, z, v, 80);
p = patch(fv, 'FaceColor', [0, 1, 1], 'FaceAlpha', 0.5, 'EdgeColor', 'none');
fig.Children.Color = 'none'; % transparent background of figure axis
view([40 40]);
pbaspect([1,1,1]);
camlight;
lighting('gouraud');
% save figure in different ways
% save as vector format, doesn't produce nice output see for example https://stackoverflow.com/questions/61631063
exportgraphics(fig, 'test.pdf', 'ContentType', 'vector', 'BackGroundColor', 'none');
% prints warning: Warning: Vectorized content might take a long time to create,
% or it might contain unexpected results. Set 'ContentType' to 'image' for better performance.
% save as rendered output with transparent background not work
exportgraphics(fig, 'test.png', 'ContentType', 'image', 'BackGroundColor', 'none');
% prints warning: Warning: Background transparency is not supported; using white instead.
% now our solution, export with two background colors
exportgraphics(fig, 'test1.png', 'ContentType', 'image', 'BackgroundColor', 'k'); % black background
exportgraphics(fig, 'test2.png', 'ContentType', 'image', 'BackgroundColor', 'w'); % white background
% load exported images back in and scale to [0,1]
u = imread('test1.png');
u = double(u) / 255;
v = imread('test2.png');
v = double(v) / 255;
% recover transparency as a
a = 1 - v + u;
a = mean(a, 3);
a = max(0, min(1, a));
m = a > eps;
% recover rgb
c = zeros(size(u));
for i = 1 : 3
ui = u(:, :, i);
ci = c(:, :, i);
ci(m) = ui(m) ./ a(m);
c(:, :, i) = ci;
end
c = max(0, min(1, c));
% store again
imwrite(uint8(c*255), 'test.transparent.png', 'Alpha', a);
% temporary files test1.png and test2.png can now be deleted
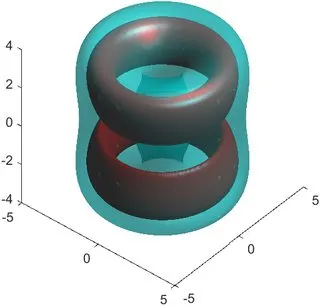
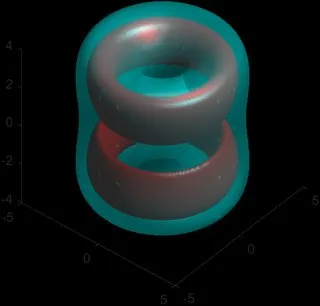 这是生成的透明图像。要查看,请保存该图像并使用合适的查看器查看。

你可以这样做,Matlab2020a或更高版本都是有效的!
x = 0:.1:2*pi;
y = sin(x);

figure;
plot(x,y,'LineWidth',4);

% save to transparented image
set(gcf, 'color', 'none');
set(gca, 'color', 'none');
exportgraphics(gcf,'transparent.emf',...   % since R2020a
    'ContentType','vector',...
    'BackgroundColor','none')
emf格式复制的。也许将其保存为 emf 格式可以保持透明度。(我自己还没有测试过) - Memming