堆叠式 D3JS 气泡图

5

嗨,我正在使用D3JS作为图表库,对Bubble Chart中的酷炫功能非常感兴趣。在主要的D3JS图表网站上,以下Bubble Chart用于比较两组数据:
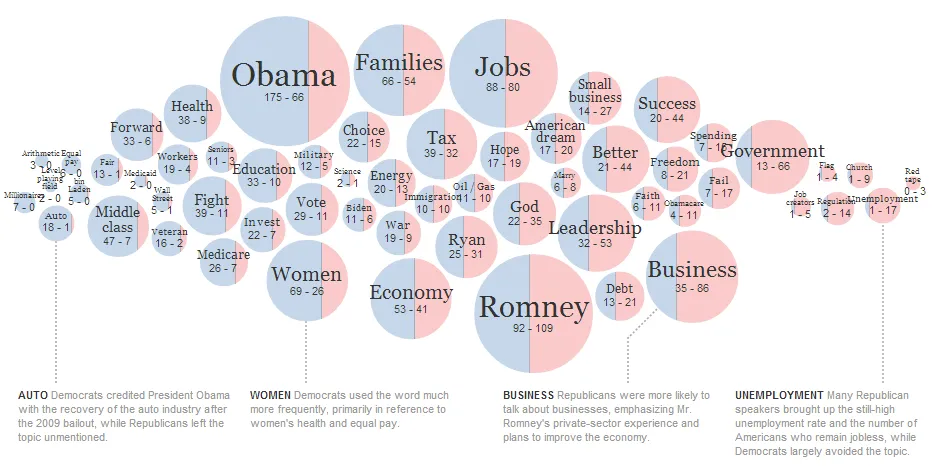
enter image description here

Bubble Chart

我想知道是否有人真正知道如何创建这样的气泡图,我很难让它工作,只使用了一个大小变量。

我只是想能够比较两组数据,例如:

主机名(45,955,158)VS活动站点(21,335,629)

我正在使用下面的代码,使用JSON检索我的数据,当涉及到js和jQuery库时,我是一个新手,因此会非常感激任何帮助。

index.html

<div class="four columns browserstats2003">
            <h3>Browser Stats 2003</h3>

        </div>        
    <div class="four columns mobilephonestats">
       <h3>Smartphone Sales 2003</h3>
       <p>The first smartphone had not been released in 2003.</p>
               <div id=""></div>


    </div>

mobile.json

{
 "name": "flare",
 "children": [
  {
   "name": "analytics",
   "children": [
    {
     "name": "cluster",
     "children": [
      {"name": "Smartphone Sales", "size": 11111},
  {"name": "Smartphone Salesa", "size": 2111}
     ]
    }
   ]
  }
 ]
}

js/js.js // JavaScript文档

$(document).ready(function () {

        //  2003 bubble chart
            var diameter = 360,
                format = d3.format(",d"),
                color = d3.scale.category20c();

            var bubble = d3.layout.pack()
                .sort(null)
                .size([diameter, diameter])
                .padding(1.5);

            var svg = d3.select(".mobilephonestats").append("svg")
                .attr("width", diameter)
                .attr("height", diameter)
                .attr("class", "bubble");

            d3.json("mobile.json", function(error, root) {
              var node = svg.selectAll(".node")
                  .data(bubble.nodes(classes(root))
                  .filter(function(d) { return !d.children; }))
                .enter().append("g")
                  .attr("class", "node")
                  .attr("transform", function(d) { return "translate(" + d.x + "," + d.y + ")"; });

              node.append("title")
                  .text(function(d) { return d.className + ": " + format(d.value); });

              node.append("circle")
                  .attr("r", function(d) { return d.r; })
                  .style("fill", function(d) { return color(d.packageName); });

              node.append("text")
                  .attr("dy", ".3em")
                  .style("text-anchor", "middle")
                  .text(function(d) { return d.className.substring(0, d.r / 3); });
            });

            // Returns a flattened hierarchy containing all leaf nodes under the root.
            function classes(root) {
              var classes = [];

              function recurse(name, node) {
                if (node.children) node.children.forEach(function(child) { recurse(node.name, child); });
                else classes.push({packageName: name, className: node.name, value: node.size});
              }

              recurse(null, root);
              return {children: classes};
            }

            d3.select(self.frameElement).style("height", diameter + "px");

// end bubble year 

        });

你看过其他气泡图表的例子吗? - Lars Kotthoff
@LarsKotthoff 是的,我尝试过了,但是没有一个例子符合我需要的。 - user0129e021939232
在我看来,你所需要做的就是用硬渐变填充气泡。哦,如果你想要更加相似或接近,则可能需要使用强制布局而非包布局。 - Lars Kotthoff
1个回答

5
在您提供的示例中,他明确使用了力导向布局,这比您使用的气泡图表要复杂一些。您需要考虑到碰撞和动画等因素。
为什么不看看他使用的JavaScript来生成它呢?
Jim Vallandingham编写了一篇详尽的教程,介绍了Bubble Clouds的基本知识。
要创建圆形中间的分割线作为某种形式的数据比较方式,"clip-paths"是前进的方向:
  • 添加两个圆,每个数据集一个。
  • 添加两个剪辑路径,每个数据集一个。
  • 给每个剪辑路径附加一个矩形。
  • 设置矩形的x属性和宽度,该属性定义了中间分隔位置。该属性必须是数据的函数。
  • 裁剪矩形和圆。

以下是代码:

var nodeEnter = node.enter().append("a")
      .attr("class", "g-node")
      .call(force.drag);

  var democratEnter = nodeEnter.append("g")
      .attr("class", "g-democrat");

  democratEnter.append("clipPath") // clip-path to crop the rectangle
      .attr("id", function(d) { return "g-clip-democrat-" + d.id; })
    .append("rect");

  democratEnter.append("circle");

  var republicanEnter = nodeEnter.append("g")
      .attr("class", "g-republican");

  republicanEnter.append("clipPath") // Clip-path to crop the rectangle
     .attr("id", function(d) { return "g-clip-republican-" + d.id; })
     .append("rect");

  republicanEnter.append("circle");

  node.selectAll("rect")
      .attr("y", function(d) { return -d.r - clipPadding; })
      .attr("height", function(d) { return 2 * d.r + 2 * clipPadding; });

  // Defining the x-attr and width of the rectangle, which effectively splits the circle
  node.select(".g-democrat rect")
      .attr("x", function(d) { return -d.r - clipPadding; }) 
      .attr("width", function(d) { return 2 * d.r * d.k + clipPadding; });

  node.select(".g-republican rect")
      .attr("x", function(d) { return -d.r + 2 * d.r * d.k; })
      .attr("width", function(d) { return 2 * d.r; });

  // Setting the clip-path to crop the circles
  node.select(".g-democrat circle")
      .attr("clip-path", function(d) { return d.k < 1 ? "url(#g-clip-democrat-" + d.id + ")" : null; });

  node.select(".g-republican circle")
      .attr("clip-path", function(d) { return d.k > 0 ? "url(#g-clip-republican-" + d.id + ")" : null; });

这应该生成类似于这样的内容:

<g class="g-democrat">
    <clipPath id="g-clip-democrat-43">
        <rect y="-63.36487389363757" height="126.72974778727514" x="-63.36487389363757" width="59.449375597303515">
        </rect>
    </clipPath>
    <circle clip-path="url(#g-clip-democrat-43)" r="59.36487389363757">
</circle></g>
<g class="g-republican">
    <clipPath id="g-clip-republican-43">
        <rect y="-63.36487389363757" height="126.72974778727514" x="-3.915498296334057" width="118.72974778727514">
        </rect>
    </clipPath>
    <circle clip-path="url(#g-clip-republican-43)" r="59.36487389363757">
</circle></g>

网页内容由stack overflow 提供, 点击上面的
可以查看英文原文,
原文链接